How We Test PSUs - 2014
by E. Fylladitakis on February 28, 2014 1:45 PM EST- Posted in
- PSUs
- Cases/Cooling/PSUs
- Testing Procedures
_678x452.jpg)
After a lengthy hiatus, we're back with a new PSU and case reviewer. As we kick off our revised power supply testing and reviews, we wanted to cover the fundamentals of how we test and what to expect. Some of this is still a work in progress, as we have not gathered all of the equipment we would like to have, and as we move forward we will periodically provide updates to our PSU testing procedures. And with that out of the way, let's discuss how we're going to go about testing power supplies.
Effective testing of a power supply requires far more than just connecting it to a PC and using a $10 multimeter to check the voltage rails. At the very least, it requires specialized (and very expensive) equipment. At this point, most people that actually know a few things about PSUs would say, "Yes, OK, you need an adjustable load and an oscilloscope." While it's true you need those items, you can't simply grab any old adjustable load and oscilloscope. What you really need is very precise, programmable electronic loads with transient testing built-in and an oscilloscope that should comply with exact specifications, among other meters and equipment. Then of course you need to know what you are doing, as it's not simply a matter of connecting a PSU to the equipment and pressing a few buttons; there are exact loading and testing procedures, described in technical papers and guides, that need to be followed.
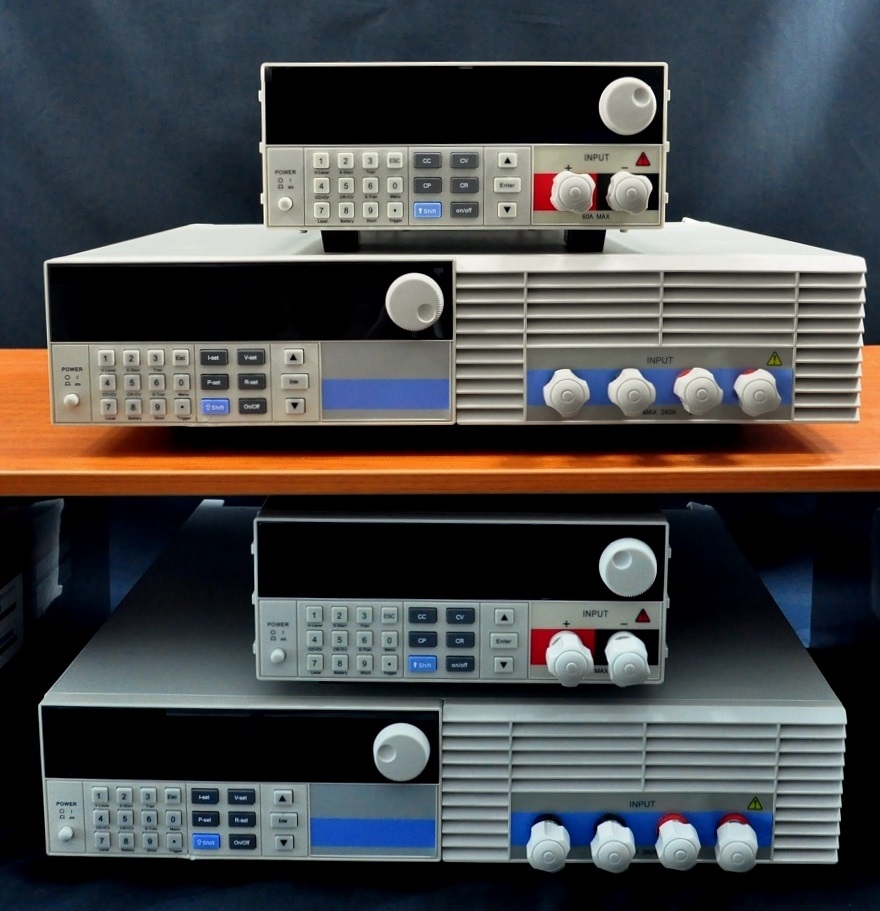
Programmable DC loads are an absolute necessity if you want to test a power supply. To that end, we acquired two high precision Maynuo M9714 1200 Watt and two Maynuo M9711 150 Watt electronic loads, which will allow us to draw up to 2400 Watts from 12 Volt lines and up to 150 Watts from each of the 3.3 Volt and 5 Volt lines. As these are quick-response programmable models, they will also allow us to perform transient tests in the future.
When testing a power supply, using even the best of multimeters are entirely useless. An oscilloscope is an absolute necessity and not just any oscilloscope. Intel's ATX design guide denotes that the oscilloscope should have a bandwidth of 20MHz; however, things are not nearly as simple as that. Even if you do want to purchase a proper oscilloscope, buying a 20MHz oscilloscope is a mistake. Digital oscilloscopes need to be capable of acquiring samples at least ten times faster than the frequency they are required to resolve. So, you need a 20MHz oscilloscope with a sampling rate of at least 200 MSa/s, and low range or USB connected devices cannot get anywhere close to that number.
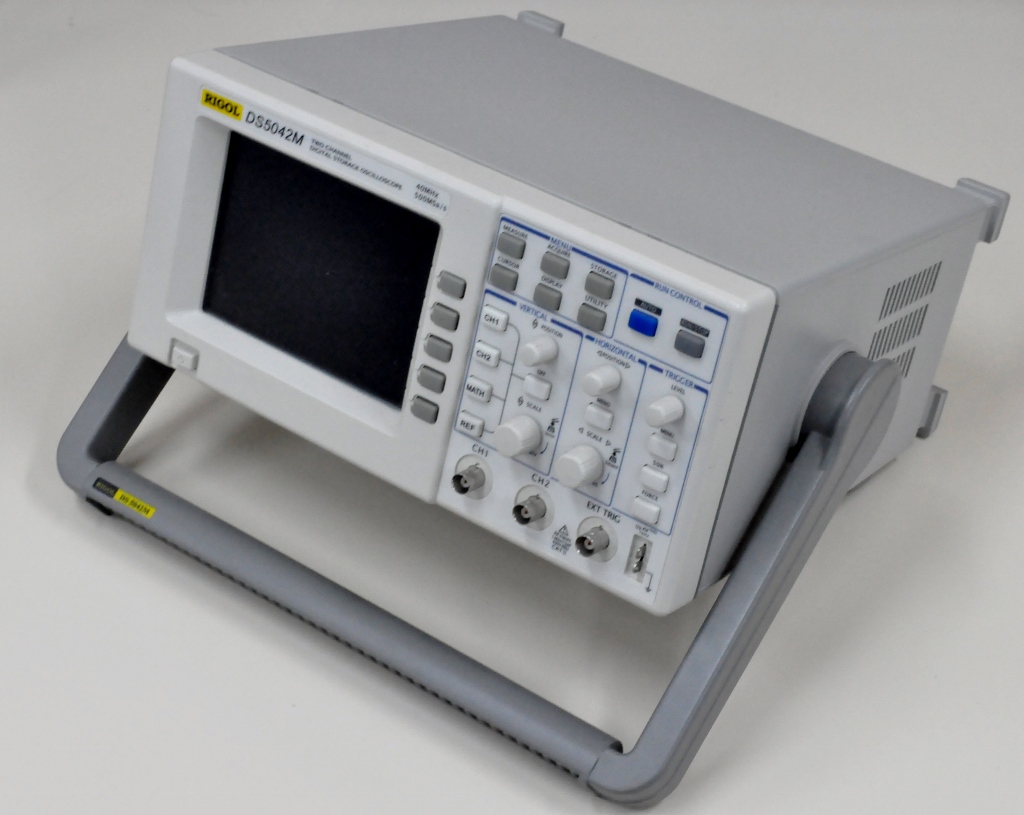
There are of course many other minor details but we will not bore you with those. It should suffice to say that for the time being we are using a Rigol DS5042M oscilloscope, which has a bandwidth of 40MHz and a real time sampling rate of 500 MSa/s. Although that sounds impressive, actually even this device is not good enough if you want to perform transient tests properly and it cannot resolve noise out of the ripple of a signal; these are tests we plan to add in the future.
Compared to the above items, testing the efficiency of a PSU is relatively simple, once you know exactly how much power you are drawing from it. Our electronic loads tell us exactly how much power is being drawn at a given time; therefore, we only need a good AC power analyzer to tell us how much power the unit is drawing from the AC outlet. Note the "good" part, as you need a power analyzer capable of displaying true RMS values, as PSUs can generate a great deal of harmonics.
Our Extech 380803 power analyzer does a very good job at reporting the level of power that our PSU requires at any given time. We should note that all testing is being performed with a 230V/50Hz input, delivered by a 3000VA VARIAC for the perfect adjustment of the input voltage. Unfortunately, we cannot perform tests at 110V/60Hz at the moment, as that requires a high output, programmable AC power source. As a rough estimate, conversion efficiency drops by 1% to 1.5% when the input voltage is lowered to 110V/ 60Hz.
Thermal and noise testing are another complex procedure. Thermal testing is relatively simple; we only had to acquire two high precision UNI-T UT-325 digital thermometers. With four temperature probes, we can monitor the ambient temperature, the exhaust temperature of the PSU, as well as the temperature of its primary and secondary heatsinks. Noise testing however cannot be performed while the unit is being tested, as the very equipment that is used to test it generates a lot of noise. Everyone says that it is impossible to keep the unit loaded with the equipment far apart in order to perform noise testing and yes, that truly is impossible. So, it cannot be done, right? Wrong.
One of the basics of the scientific method is that you isolate the problem from a system and resolve it on its own. In other words, instead of trying to do the impossible and measure the noise of a power supply while we are testing it, there is nothing keeping us from using a non-intrusive laser tachometer to record the speed of the fan instead. Then, we can simply test the unit on its own, with the fan hotwired to a small fanless, adjustable DC PSU that we fabricated, taking noise readings with our Extech HD600 for the RPM range of the fan and cross-referencing the two tables. Not quite that difficult, was it? There is a catch however; as the unit will not be powered at the time of sound level testing, the meter cannot record any coil whine noise. Coil whine is clearly audible during testing though and we will make sure to report it if (when) we encounter a PSU whose coils could have used a little bit more lacquer. The background noise of our testing environment is about 30.4 dB(A), which figure resembles a quiet room at night. Equipment noise usually becomes audible when our instrumentation reads above 33.5 dB(A).
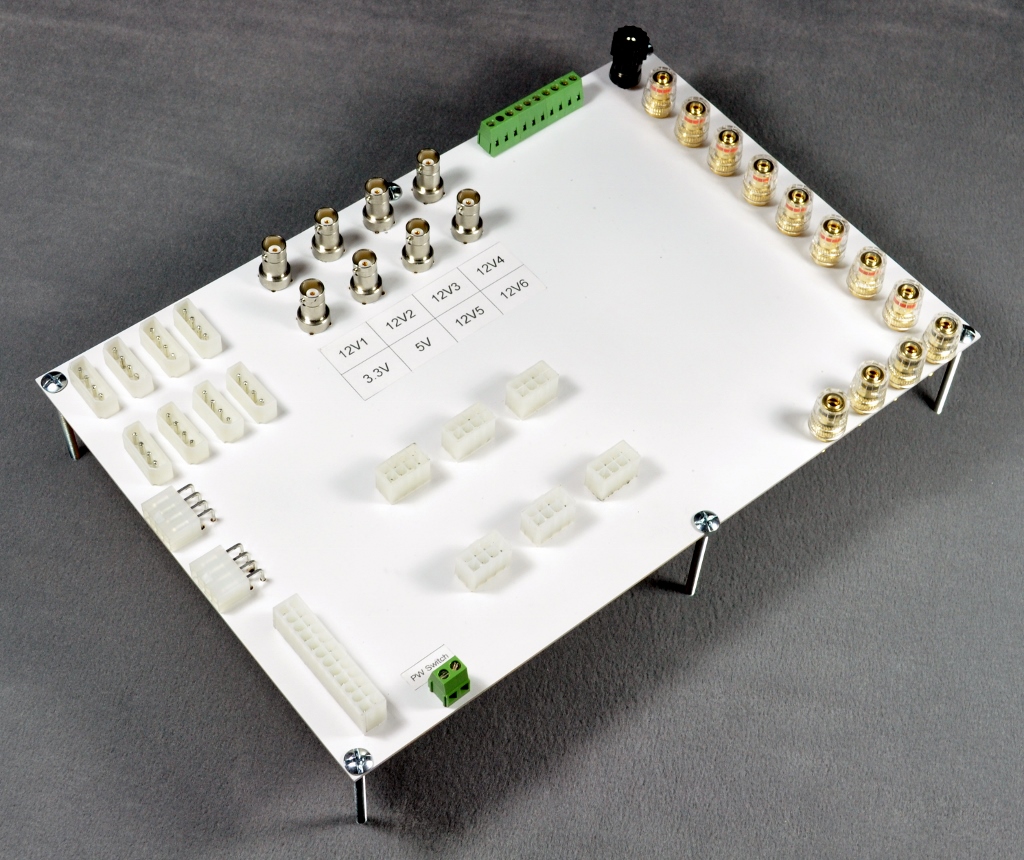
In order to facilitate testing power supplies more effectively, we created a test fixture for the connection between the PSU and the testing equipment, as well as a proprietary hot box. The hot box is not much more than a closed case with an air-heating device, which is controlled via a DAQ and our software. It is imperative to heat the air inside the box, not the box itself, in order to create good testing conditions. Admittedly, this self-made contraption is not perfect as it is small and has a very slow reaction rate, but it does work well for the means of simulating the environment inside a computer case. Therefore, testing will be performed at room temperature (maintained at 25 °C) and inside the hotbox (at 45-50 °C). Remember that efficiency certifications are performed at room temperature (25 °C) and a power supply can easily fail to meet its efficiency certification standards inside the hotbox!
As for the testing procedure, there are specific, detailed guidelines on how to perform it. All testing is done in accordance with Intel's Power Supply Design Guide for Desktop Form Factors and with the Generalized Test Protocol for Calculating the Energy Efficiency of Internal AC-DC and DC-DC Power Supplies. These two documents describe in detail how the equipment should be interconnected, how loading should be performed (yes, you do not simply load the power lines randomly), and the basic methodology for the acquisition of each data set. However, not all of our testing is covered and/or endorsed by these guidelines.
(Update, Apr 20th, 2015, Click for the detailed post)
Even though these documents are just a few years old, their methods fail to account for modern "enthusiast grade" computer SMPS. The industry has been making leaps on the creation of more energy-efficient devices, continuously lowering their power requirements. Nowadays, the vast majority of computers that require very powerful PSUs simply employ multiple components, such as numerous graphics cards. As the majority of energy-consuming components require a 12 V source, PSU manufacturers have been continuously driving the 12 V output of their units upwards, while the 3.3V/5V outputs remained inert or are getting weaker. There are many design rules that modern "enthusiast-grade" PSUs do not adhere to nowadays, such as the current safely limits and the maximum size of the chassis, but this particular change creates a problem with the generalized test protocol.
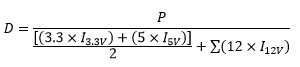
According to the generalized test protocol, the derating factor D of the 3.3V/5V lines should be:
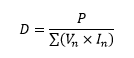
Simply put, the formula is maximum rated power output of the unit divided by the sum of the power output ratings of each individual power line.
However, this formula frequently leads to the overloading of the 3.3V/5V lines with >1 kW PSUs. The effect is particularly severe in some high efficiency units, in which the designers moved the 3.3V/5V DC-to-DC conversion circuits on the connectors PCB, reducing their maximum power output significantly. Although some PSUs would operate normally even if their 3.3V/5V lines were overloaded, the continuous degradation of the 3.3V/5V lines in comparison to the 12 V line resulted to PSUs appearing in our labs that could not operate under such conditions. Therefore, we had to alter the derating factor formula in order to compensate for real world testing. Without at least two significant energy consumers, no modern system requires > 500 Watts. Greater power demand suggests the presence of devices that load only the 12 V line (i.e. GPUs, CPUs, liquid cooling pumps, Peltier effect coolers, etc.). After certain calculations and research, for units with a rated power output over 400 Watts, we will be using the following formula:
Which effectively half the impact of the 3.3V/5V lines on the calculation of the derating factor, imposing the difference on the 12V line. Furthermore, the loading criterion of the 3.3V/5V lines for a load rating X (in % of the unit's maximum output) is now changed to:
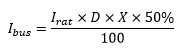
For the 12 V line(s), the loading criterion remains unchanged.
This formula results to the more realistic representation of the requirements that actual systems have, at least up to a power output realizable today.
(End of update)
Furthermore, there are no guidelines on how transient tests should be performed and the momentary power-up cross load testing that Intel recommends is far too lenient. Intel recommends that the 12V line should be loaded to < 0.1A and the 3.3V/5V lines up to just 5A. We also perform two cross load tests of our own design. In test CL1, we load the 12V line up to 80% of its maximum capacity and the 3.3V/5V lines with 2A each. In test CL2, we load the 12V line with 2A and the 3.3V/5V lines up to 80% of their maximum combined capacity.
Furthermore, it has been suggested that efficiency testing needs to be performed at specific load intervals (20% - 50% - 100%), which is considered to be the normal operating range of a PSU. However, modern systems can easily have their energy demand drop dramatically while idling, which is why we will be testing power supplies starting at 5% of their rated capacity, not 20%. Note that the conversion efficiency of all switching PSUs literally takes a dive when the load is very low, so large drops of >10% are expected and natural.
Any questions or comments on our PSU testing procedures are welcome, and as noted earlier we plan to add and/or improve some of the testing over the coming months with some additional hardware. We will provide an updated article when/if such changes are required.


49 Comments
View All Comments
Rick83 - Friday, February 28, 2014 - link
It would be interesting to get efficiency not just as a percentage, but also as an absolute value of thermal loss in the PSU. Especially for the idle loads, this is more interesting than the relative efficiency.JarredWalton - Friday, February 28, 2014 - link
What you're asking for is for us to just provide a second graph showing PSU thermal load (load * (1 - efficiency)), right? If I understand you correctly, we should be able to add such a graph without much difficulty. I'll run that by "E" and see what he thinks.edzieba - Monday, March 3, 2014 - link
Another option would be a graph of output power vs. power draw (with a 1:1 guide line). This would give a more intuitive view of how much of an effect (or the lack thereof) low efficiencies at low loads have.Rick83 - Friday, February 28, 2014 - link
Oh, and something I saw other sites do, which might be interesting: Test not only at load levels relative to the absolute performance, but at some "common" load levels, such as 30W for an idling desktop system, 150W for a CPU loaded desktop system, 300W for a gaming system, 500W for a SLI/CF system, and then maybe add 800W and 1000W for the bigger PSUs to simulate tri/quad GPU systems and mining rigs. This way PSUs can be compared how they perform for a fixed load, which is more important when making a buying decision for a certain system.Guspaz - Friday, February 28, 2014 - link
Great idea. If I'm trying to select a power supply for a system, it's way more interesting to me to know (for example) how loud each of them would be at 300W load, rather than at 50% (which would be different wattages for different PSUs). Percentages are of limited utility for comparing between PSUs unless they all have identical ratings, which isn't what happens in the real world. As in, if a power supply rated 100W higher is much quieter, it might be a better option even if the extra power isn't required.E.Fyll - Friday, February 28, 2014 - link
If I would replace percentages with wattage, the shape of the graph would remain entirely unchanged. If you do want to compare different units, you only have to check the percentage that corresponds to the load you want to check. It's a simple multiplication.Cellar Door - Sunday, March 2, 2014 - link
E.Fyll - the seasonic review is one of the best PSU reviews I have read in a while, awesome job. Very clear and easy to read. Could not ask for more!ShieTar - Monday, March 3, 2014 - link
I think what Guspaz is getting at, and what is not very clear in the above article, is that he wants to see actual testing at other loads than 20%, 50%, 80%. From the actual test you posted in parallel it looks to me like you do indeed test at the entire load range, with much more than only 3 specific load cases. Maybe you just need to make that a bit more clear in the above text?E.Fyll - Friday, February 28, 2014 - link
That's not really good practice. First of all, none of the systems that you described do reach such power figures. For example, a single gaming system is between 160 W and 220 W at full load while a triple SLI system may reach anywhere between 400 W and 700 W. There are great variances between systems, plus it would not be equal testing conditions for every unit. It is far more reasonable to test the unit at specified intervals. Most charts are provided across the entire load range, so you can easily assess the performance of your unit, assuming that you do know the power of your system.Rick83 - Friday, February 28, 2014 - link
While it may not give equal testing conditions, selecting a number of fixed points for taking measurements does allow for easier alignment of the different efficiency curves, and for easier readability and comparison between the different units.Also, the numbers I gave were just one example of a spread of useful points - any number of reasonably spaced points in the 10-1000W gamut will do the job.
Alternatively, an absolute power based graph might also work, just to do the alignment, but just 4 load points on a 1000W PSU might not be enough to compare it against a set of 800 and even 600W PSUs, which might be cross-shopped for a system that has a TDP-sum around 550W. (According to the various 50%/80% rules and whatnot that many believe in)