Samsung Portable SSD T7 Shield Review: Flagship PSSD Gets IP65 Avatar
by Ganesh T S on July 20, 2022 8:00 AM ESTPerformance Benchmarks
Benchmarks such as ATTO and CrystalDiskMark help provide a quick look at the performance of the direct-attached storage device. The results translate to the instantaneous performance numbers that consumers can expect for specific workloads, but do not account for changes in behavior when the unit is subject to long-term conditioning and/or thermal throttling. Yet another use of these synthetic benchmarks is the ability to gather information regarding support for specific storage device features that affect performance.
Synthetic Benchmarks - ATTO and CrystalDiskMark
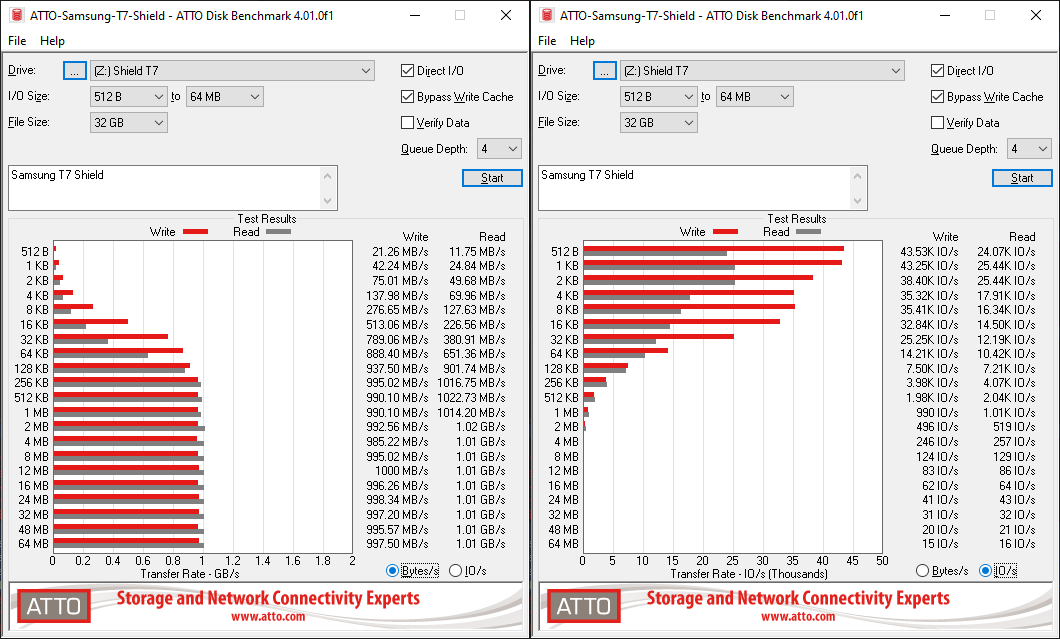
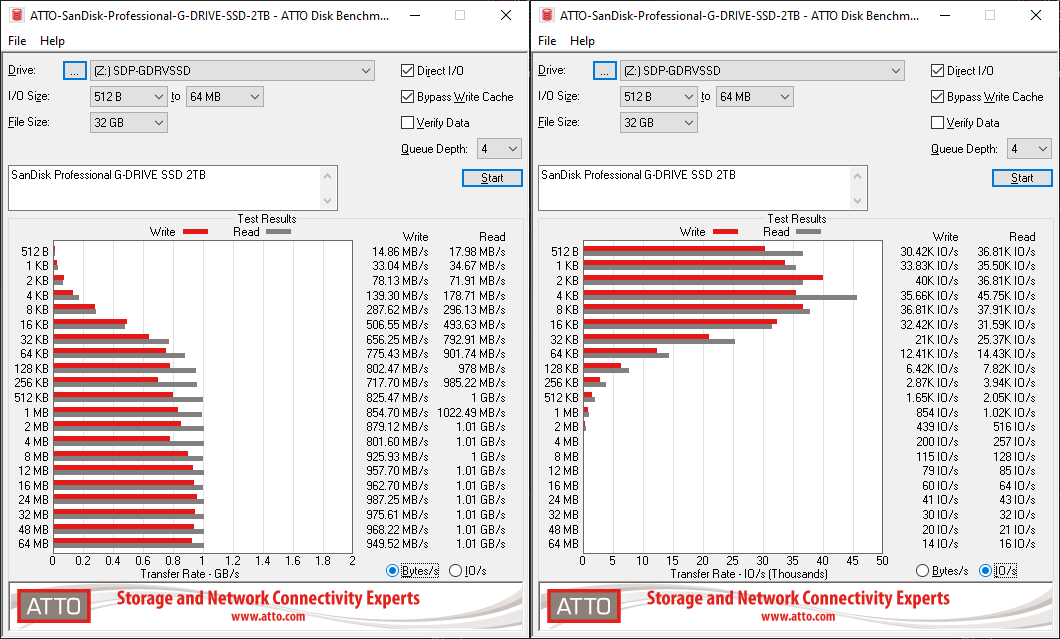
Samsung claims read and write speeds of 1050 MBps and 1000 MBps respectively, and these are backed up by the ATTO benchmarks provided below. ATTO benchmarking is restricted to a single configuration in terms of queue depth, and is only representative of a small sub-set of real-world workloads. It does allow the visualization of change in transfer rates as the I/O size changes, with optimal performance being reached around 256KB for a queue depth of 4.
| ATTO Benchmarks | |
| TOP: | BOTTOM: |
 |
|
 |
|
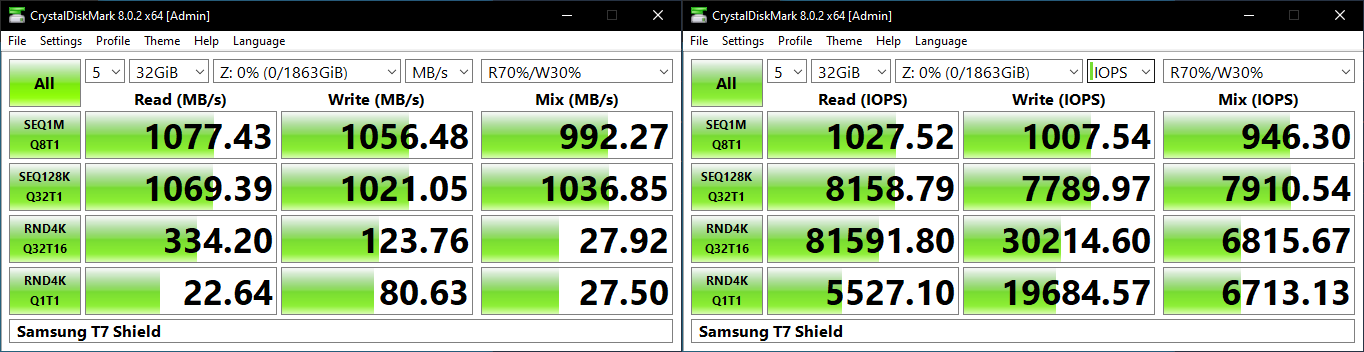
CrystalDiskMark. for example, uses four different access traces for reads and writes over a configurable region size. Two of the traces are sequential accesses, while two are 4K random accesses. Internally, CrystalDiskMark uses the Microsoft DiskSpd storage testing tool. The 'Seq128K Q32T1' sequential traces use 128K block size with a queue depth of 32 from a single thread, while the '4K Q32T16' one does random 4K accesses with the same queue configuration, but from multiple threads. The 'Seq1M' traces use a 1MiB block size. The plain 'Rnd4K' one uses only a single queue and single thread . Comparing the '4K Q32T16' and '4K Q1T1' numbers can quickly tell us whether the storage device supports NCQ (native command queuing) / UASP (USB-attached SCSI protocol). If the numbers for the two access traces are in the same ballpark, NCQ / UASP is not supported. This assumes that the host port / drivers on the PC support UASP.
| CrystalDiskMark Benchmarks | |
| TOP: | BOTTOM: |
 |
|
 |
|
The numbers from CrystalDiskMark are more than those claimed by Samsung, but typical of similar PSSDs which tend to excel in short-duration sequential workloads. Both NCQ and UASP are supported.
AnandTech DAS Suite - Benchmarking for Performance Consistency
Our testing methodology for storage bridges / direct-attached storage units takes into consideration the usual use-case for such devices. The most common usage scenario is transfer of large amounts of photos and videos to and from the unit. Other usage scenarios include the use of the unit as a download or install location for games and importing files directly from it into a multimedia editing program such as Adobe Photoshop. Some users may even opt to boot an OS off an external storage device.
The AnandTech DAS Suite tackles the first use-case. The evaluation involves processing five different workloads:
- AV: Multimedia content with audio and video files totalling 24.03 GB over 1263 files in 109 sub-folders
- Home: Photos and document files totalling 18.86 GB over 7627 files in 382 sub-folders
- BR: Blu-ray folder structure totalling 23.09 GB over 111 files in 10 sub-folders
- ISOs: OS installation files (ISOs) totalling 28.61 GB over 4 files in one folder
- Disk-to-Disk: Addition of 223.32 GB spread over 171 files in 29 sub-folders to the above four workloads (total of 317.91 GB over 9176 files in 535 sub-folders)
Except for the 'Disk-to-Disk' workload, each data set is first placed in a 29GB RAM drive, and a robocopy command is issue to transfer it to the external storage unit (formatted in exFAT for flash-based units, and NTFS for HDD-based units).
robocopy /NP /MIR /NFL /J /NDL /MT:32 $SRC_PATH $DEST_PATH
Upon completion of the transfer (write test), the contents from the unit are read back into the RAM drive (read test) after a 10 second idling interval. This process is repeated three times for each workload. Read and write speeds, as well as the time taken to complete each pass are recorded. Whenever possible, the temperature of the external storage device is recorded during the idling intervals. Bandwidth for each data set is computed as the average of all three passes.
The 'Disk-to-Disk' workload involves a similar process, but with one iteration only. The data is copied to the external unit from the CPU-attached NVMe drive, and then copied back to the internal drive. It does include more amount of continuous data transfer in a single direction, as data that doesn't fit in the RAM drive is also part of the workload set.
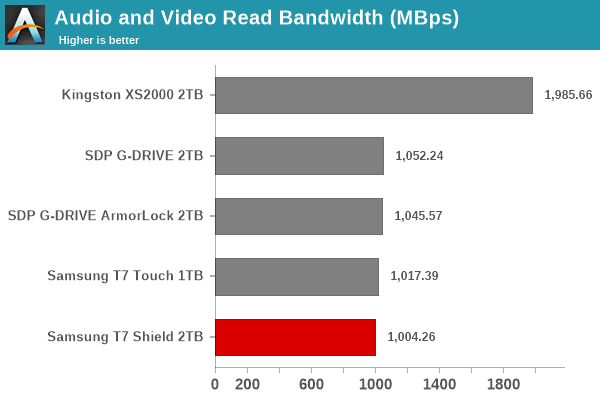
The Kingston XS2000 is the leader in all the workloads, but that is to be expected, given its USB 3.2 Gen 2x2 (20 Gbps) interface. If the XS2000 is ignored, It can be seen that there is no significant gulf in the numbers between the different units across all the workloads - in fact, most are within the run-to-run variations. For all practical purposes, the casual user will notice no difference between them in the course of normal usage. However, power users may want to dig deeper to understand the limits of each device. To address this concern, we also instrumented our evaluation scheme for determining performance consistency.
Aspects influencing the performance consistency include SLC caching and thermal throttling / firmware caps on access rates to avoid overheating. This is important for power users, as the last thing that they want to see when copying over 100s of GB of data is the transfer rate going down to USB 2.0 speeds.
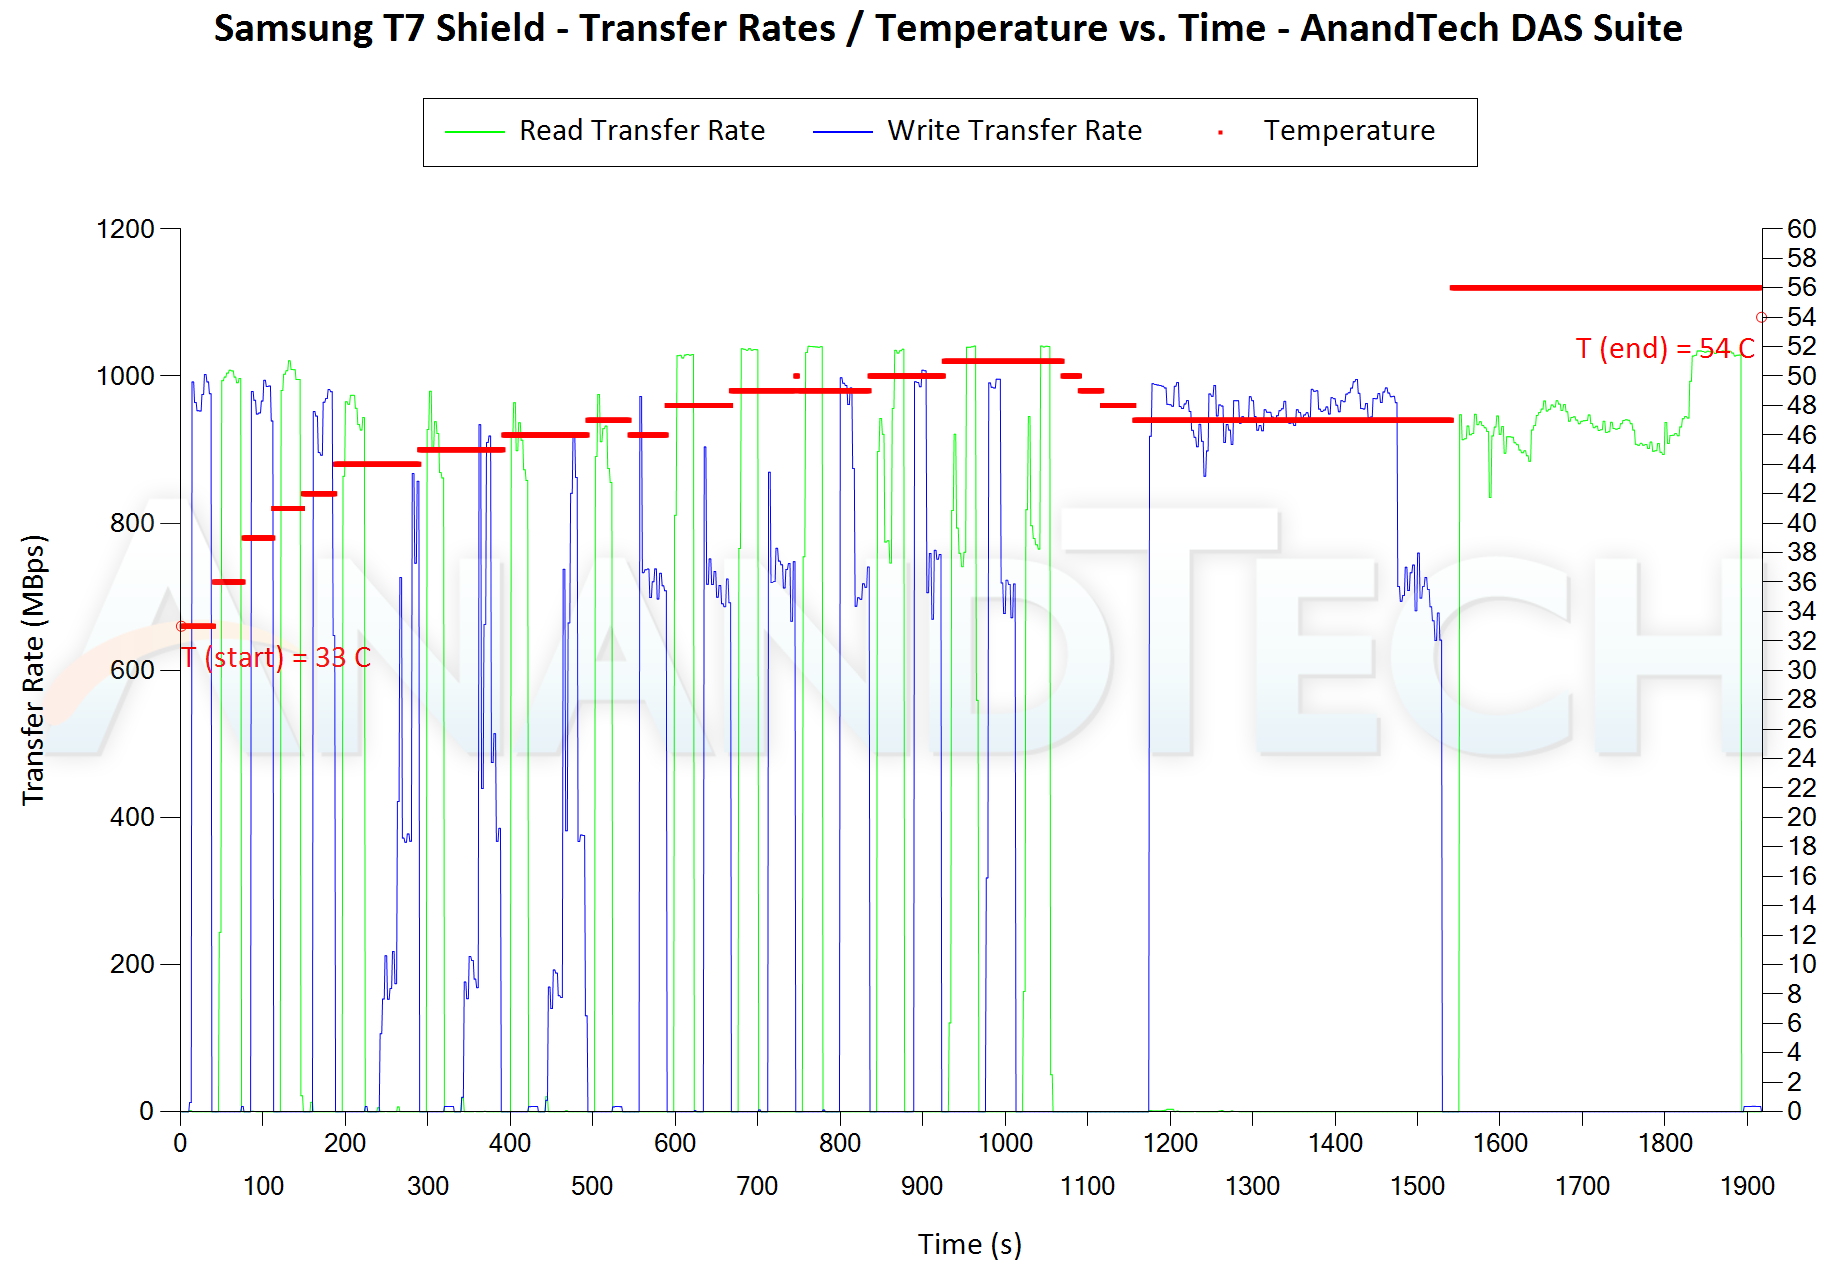
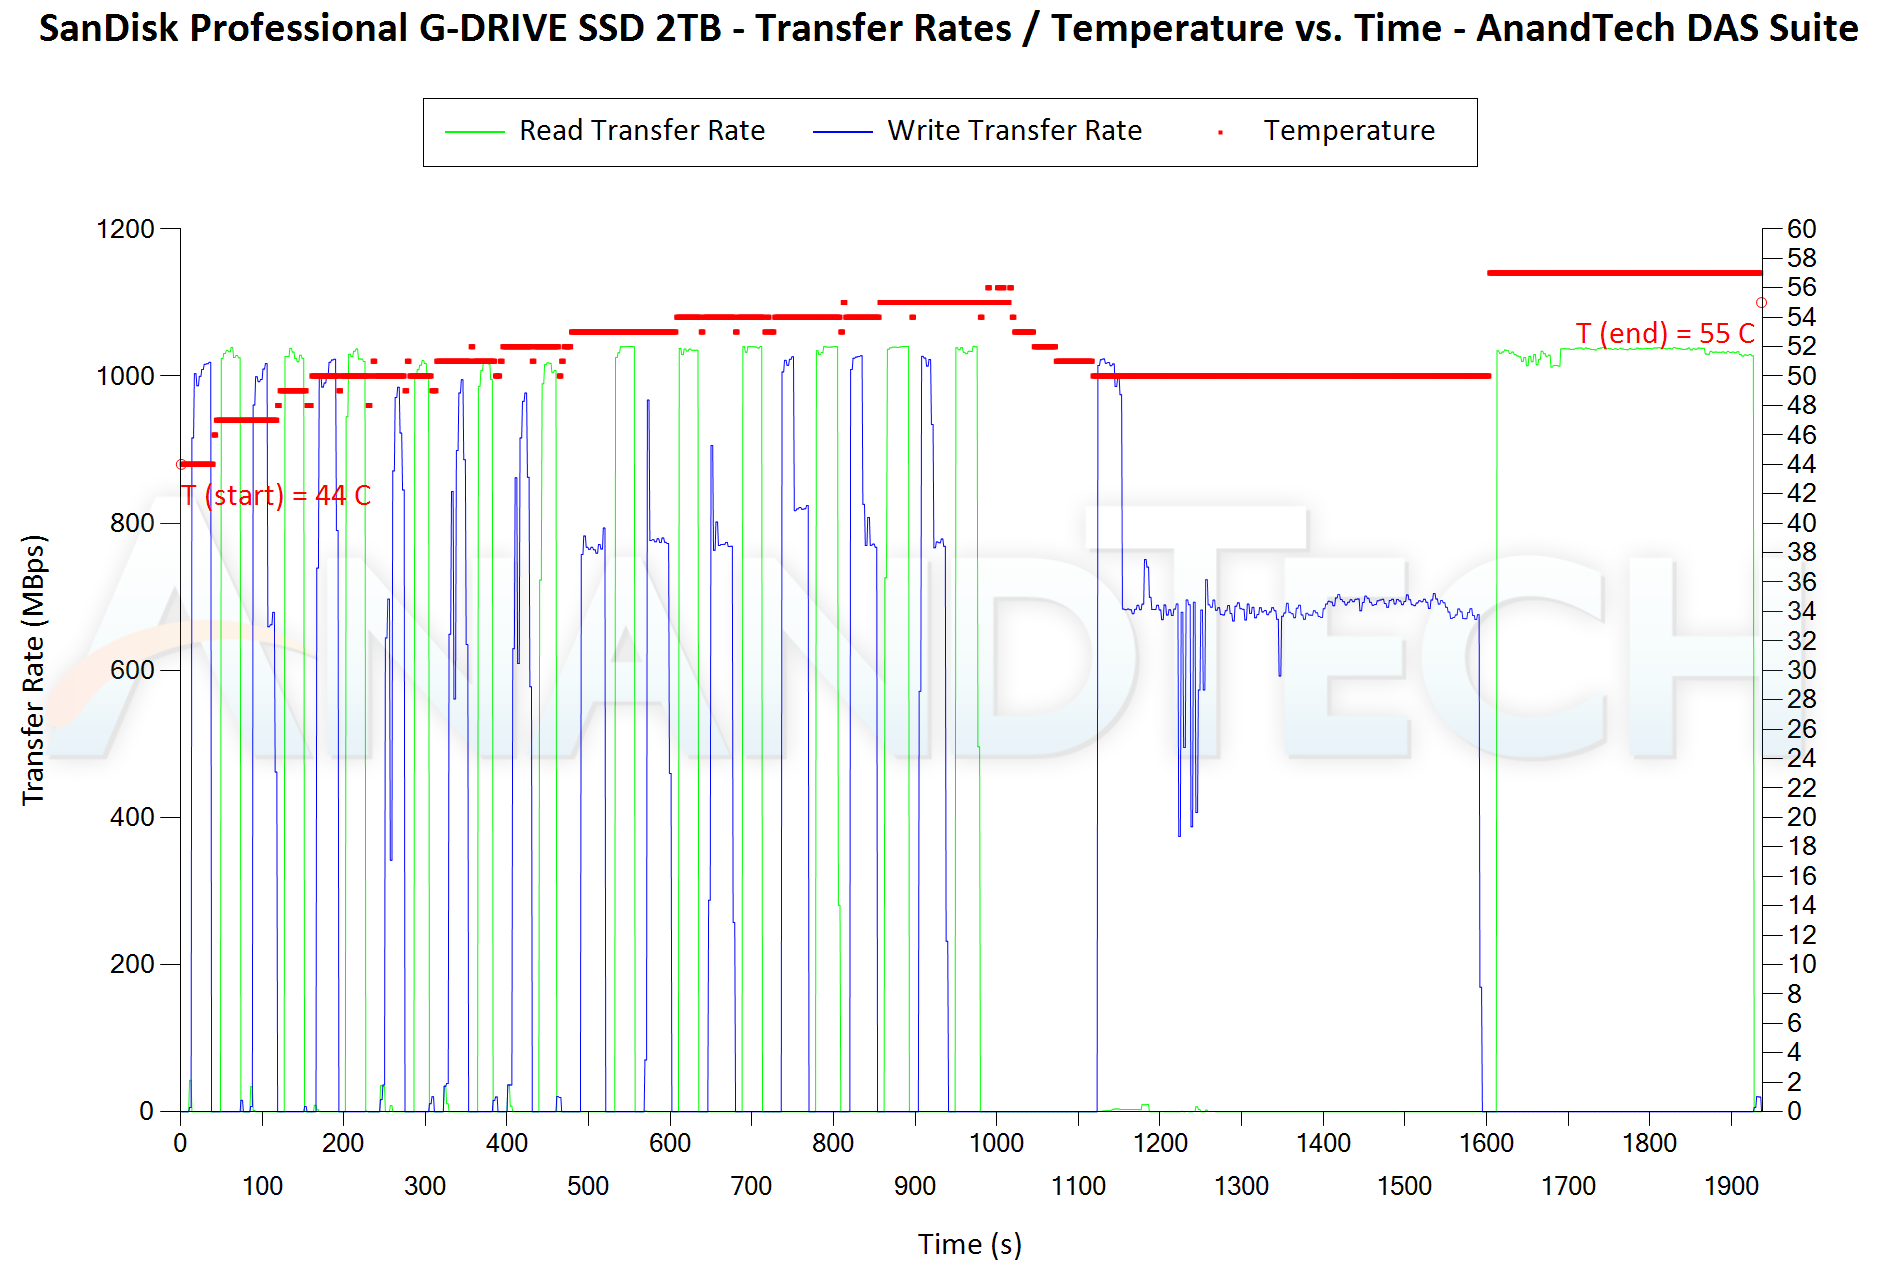
In addition to tracking the instantaneous read and write speeds of the DAS when processing the AnandTech DAS Suite, the temperature of the drive was also recorded. In earlier reviews, we used to track the temperature all through. However, we have observed that SMART read-outs for the temperature in NVMe SSDs using USB 3.2 Gen 2 bridge chips end up negatively affecting the actual transfer rates. To avoid this problem, we have restricted ourselves to recording the temperature only during the idling intervals. The graphs below present the recorded data.
| AnandTech DAS Suite - Performance Consistency | |
| TOP: | BOTTOM: |
 |
|
 |
|
The first three sets of writes and reads correspond to the AV suite. A small gap (for the transfer of the video suite from the internal SSD to the RAM drive) is followed by three sets for the Home suite. Another small RAM-drive transfer gap is followed by three sets for the Blu-ray folder. This is followed up with the large-sized ISO files set. Finally, we have the single disk-to-disk transfer set.
We can see that the T7 Shield starts off a bit slow in the Home suite (with the small-sized files) compared to other PSSDs. However, in the disk-to-disk set, it is able to maintain close to 1GBps performance without falling off the cliff after running out of the SLC cache. In fact, the drop in the rate towards the end is more due to small-sized files, rather than a SLC cliff. Despite ensuring close to peak performance all through, the temperature at the end was just 54C.
PCMark 10 Storage Bench - Real-World Access Traces
There are a number of storage benchmarks that can subject a device to artificial access traces by varying the mix of reads and writes, the access block sizes, and the queue depth / number of outstanding data requests. We saw results from two popular ones - ATTO, and CrystalDiskMark - in a previous sub-section. More serious benchmarks, however, actually replicate access traces from real-world workloads to determine the suitability of a particular device for a particular workload. Real-world access traces may be used for simulating the behavior of computing activities that are limited by storage performance. Examples include booting an operating system or loading a particular game from the disk.
PCMark 10's storage bench (introduced in v2.1.2153) includes four storage benchmarks that use relevant real-world traces from popular applications and common tasks to fully test the performance of the latest modern drives:
- The Full System Drive Benchmark uses a wide-ranging set of real-world traces from popular applications and common tasks to fully test the performance of the fastest modern drives. It involves a total of 204 GB of write traffic.
- The Quick System Drive Benchmark is a shorter test with a smaller set of less demanding real-world traces. It subjects the device to 23 GB of writes.
- The Data Drive Benchmark is designed to test drives that are used for storing files rather than applications. These typically include NAS drives, USB sticks, memory cards, and other external storage devices. The device is subjected to 15 GB of writes.
- The Drive Performance Consistency Test is a long-running and extremely demanding test with a heavy, continuous load for expert users. In-depth reporting shows how the performance of the drive varies under different conditions. This writes more than 23 TB of data to the drive.
Despite the data drive benchmark appearing most suitable for testing direct-attached storage, we opt to run the full system drive benchmark as part of our evaluation flow. Many of us use portable flash drives as boot drives and storage for Steam games. These types of use-cases are addressed only in the full system drive benchmark.
The Full System Drive Benchmark comprises of 23 different traces. For the purpose of presenting results, we classify them under five different categories:
- Boot: Replay of storage access trace recorded while booting Windows 10
- Creative: Replay of storage access traces recorded during the start up and usage of Adobe applications such as Acrobat, After Effects, Illustrator, Premiere Pro, Lightroom, and Photoshop.
- Office: Replay of storage access traces recorded during the usage of Microsoft Office applications such as Excel and Powerpoint.
- Gaming: Replay of storage access traces recorded during the start up of games such as Battlefield V, Call of Duty Black Ops 4, and Overwatch.
- File Transfers: Replay of storage access traces (Write-Only, Read-Write, and Read-Only) recorded during the transfer of data such as ISOs and photographs.
PCMark 10 also generates an overall score, bandwidth, and average latency number for quick comparison of different drives. The sub-sections in the rest of the page reference the access traces specified in the PCMark 10 Technical Guide.
Booting Windows 10
The read-write bandwidth recorded for each drive in the boo access trace is presented below.
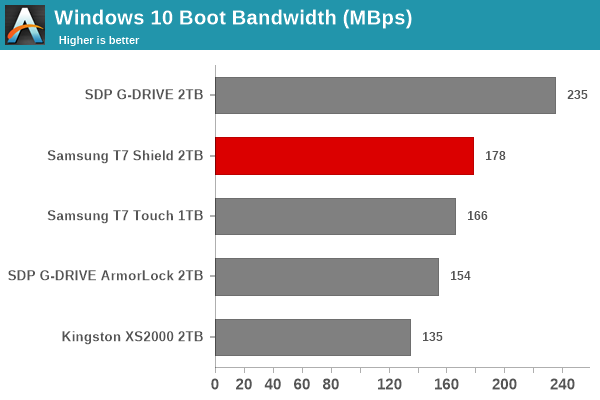
This workload rewards SSDs that have low read latencies, and the raw interface speed matters much less. The T7 Shield is among the top performers in that metric.
Creative Workloads
The read-write bandwidth recorded for each drive in the sacr, saft, sill, spre, slig, sps, aft, exc, ill, ind, psh, and psl access traces are presented below.
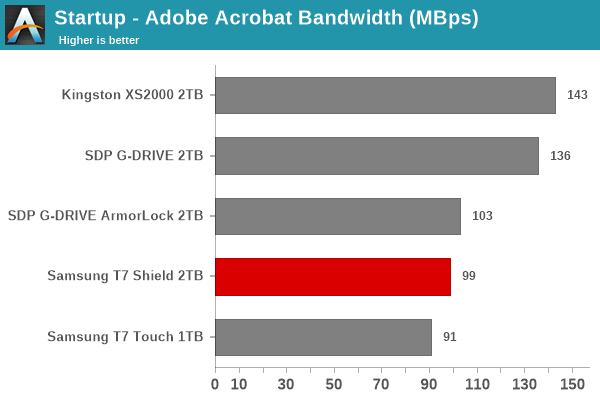
The performance in these workloads depends on the raw interface speed, and the capabilities of the internal SSD. The top drives are either those with a 20 Gbps interface, or ones with DRAM-equipped internal SSDs. Since the T7 Shield is a DRAM-less PSSD, it comes in the middle of the pack.
Office Workloads
The read-write bandwidth recorded for each drive in the exc and pow access traces are presented below.
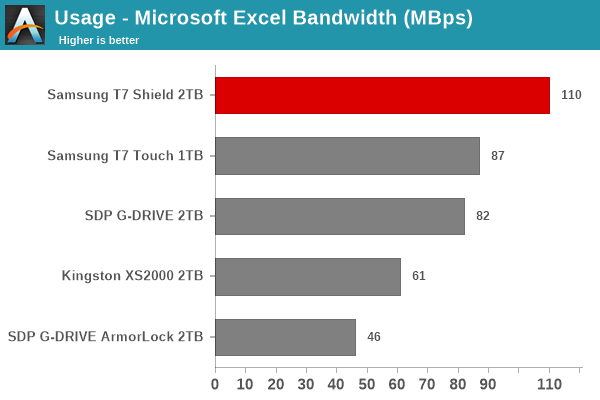
While the T7 Shield comes out on top in the Excel workload, it comes in last in the Powerpoint one - performance variations representative of the type of workloads that the PSSD firmware is tuned to.
Gaming Workloads
The read-write bandwidth recorded for each drive in the bf, cod, and ow access traces are presented below.
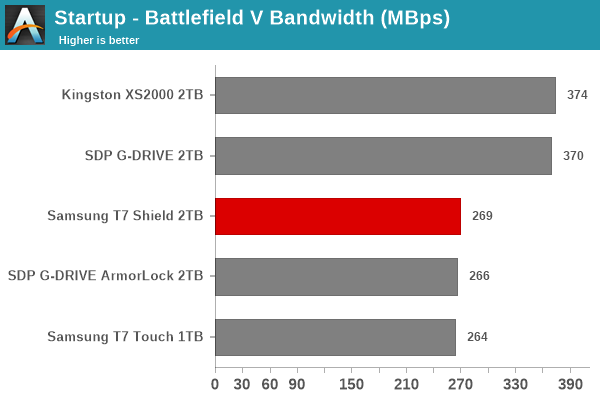
Most of the gaming benchmark traces reward raw interface speeds, and so it is not surprising to see the XS2000 come out on top. The DRAM-equipped G-DRIVE also performs admirably. Among the other three PSSDs, there is not much to differentiate.
Files Transfer Workloads
The read-write bandwidth recorded for each drive in the cp1, cp2, cp3, cps1, cps2, and cps3 access traces are presented below.
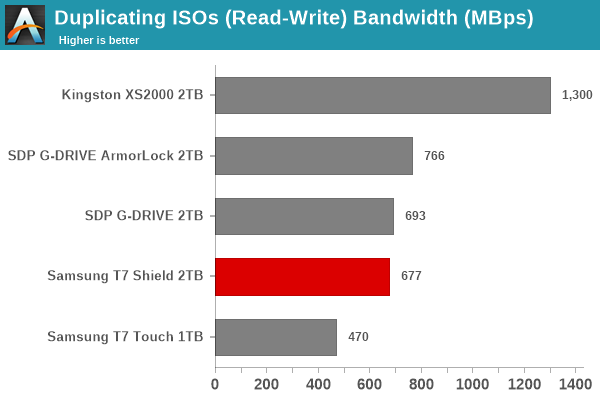
Results in this workload set are similar to the ones we observed in the AnandTech DAS Suite. The T7 Shield comes in the middle of the pack right through.
Overall Scores
PCMark 10 reports an overall score based on the observed bandwidth and access times for the full workload set. The score, bandwidth, and average access latency for each of the drives are presented below.
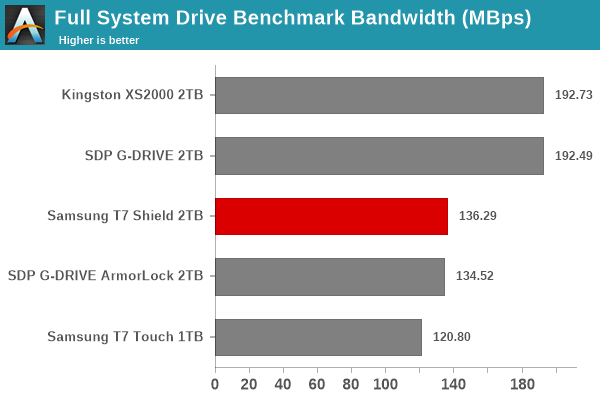
The Samsung T7 Shield lands right in the middle of the pack. Among the 1GBps-class PSSDs, the drive loses out only to the DRAM-equipped SanDisk Professional G-DRIVE.


10 Comments
View All Comments
s-plus - Wednesday, July 20, 2022 - link
I think I need to be a PhD to be able to fully understand this article.tipoo - Wednesday, July 20, 2022 - link
Hey Ganesh, I'd really love to see this type of in depth SSD testing on M2/M1 Macs, the whole youtube sphere just looks at surface level peak sequential transfer rates and calls it a day and thinks they're as fast as DDR2, but that's not the case on mixed file size transfers, random 4k reads/writes, what are the IOPS, etc. I'd love to see Anandtech dig into them.timecop1818 - Thursday, July 21, 2022 - link
You can no longer run a real OS on these so why bother testing? The only people buying them are precisely the YouTube idiot audience, so all is well.tipoo - Thursday, July 21, 2022 - link
Is Linux a "real" OS, because both a native port and VMs work? Should I even engage in this?calc76 - Thursday, July 21, 2022 - link
Linux works on it somewhat, but is still missing a lot as Asahi is having to reverse engineer everything. Asahi might eventually get to a fully usable state prior to the hardware becoming obsolete, but I wouldn't recommend buying one to run Linux at present unless you are helping to reverse engineer it.tipoo - Friday, July 22, 2022 - link
You can run Linux today in a container until native support is finalized. Besides, macOS is definitely a "real" OS unless the first guy defines that as only Windows. It's just a troll comment.web2dot0 - Thursday, July 21, 2022 - link
How fast do you need the external SSD to run?. If you can stream videos, edit videos, export videos, and transfer data reasonably fast, that's all a consumer needs.If you want it to perform like a data centre ssd, it's gonna consume WAAY more power
Hixbot - Tuesday, July 26, 2022 - link
You mentioned edited videos, but I'm not sure you appreciate the bottleneck of transfer speeds during that work flow.Editing 4k/8k video without pulling you hair out requires very fast drives, if you are going to do that on an external, which I can think of many reasons why that might be done, fast external drives are very important.
Besides that, running games straight off a fast external SSD benefits console gamers and gamers on systems like the Nvidia Shield.
artifex - Saturday, July 23, 2022 - link
The beige enclosure reminds me of a fig newton.Flying Aardvark - Saturday, July 23, 2022 - link
I bought the T7 Shield 2TB because of the price and the performance consistency. I don't see how the Sandisk competes. They both start out at 1GB/sec, but the Sandisk collapses to 700MBps. For system image backups and assorted files like old MP3s that I only occasionally reference, this drive was the one I've been waiting for at $200. Great value and it's ready for anything I throw at it going forward. My system has Thunderbolt 4 but a drive that maxes out that interface consistently is not going to be this price.