How We Test PCIe 4.0 Storage: The AnandTech 2021 SSD Benchmark Suite
by Billy Tallis on February 1, 2021 1:15 PM ESTIO Traces: AnandTech Storage Bench (ATSB)
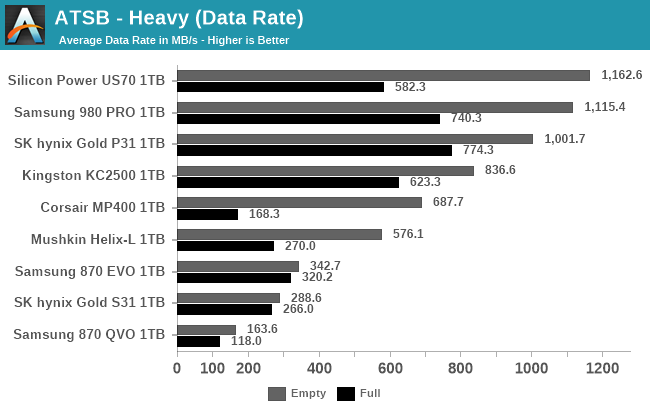
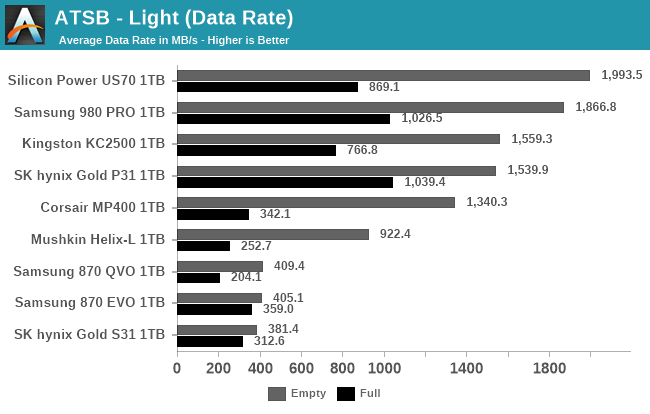
Our in-house suite of storage traces has been a staple of our SSD reviews for almost a decade. The current versions of the AnandTech Storage Bench (ATSB) Light and Heavy tests were introduced in 2011, but soon proved to be insufficient for stressing newer SSDs that were faster and larger. The Destroyer was added in 2013 to provide a much longer and more intense test, and in 2015 we started running the Light and Heavy tests twice: once on an empty drive, and again on a full drive to show the worst-case performance drop.
While these IO traces were recorded a number of years ago, upon regression analysis to a modern environment, the mix of random vs sequential transfers are almost identical. IO patterns involved in ordinary consumer PC usage haven't changed drastically in the past decade. Downloading and installing a recent AAA video game involves a lot more total IO, but things like the mix of random vs sequential transfers are still pretty similar.
The way we have enabled recorded the tests also removes any historic limitations of queue depth limits - IO tracing at the OS level enables the capture of dozens or hundreds of IOs at once, such that playback on modern NVMe systems feel the brute force of the IO required. In practice, queue depths during ordinary desktop usage are usually in the single digits, and on fast NVMe drives like Intel's Optane SSD the queue depths experienced by the drive will tend to be even a bit lower. In the case of TRIM or flush commands, these are relatively uncommon during ordinary consumer workloads, and are often highly variable and inconsistent in their timing, and so those are not present in the test. This was more an issue with older SSDs anyway. Similarly with enterprise drives, most of which enable their own data management.
The IO traces used for the ATSB tests originally recorded the precise timing of every IO operation. During the playback process, the idle times in the trace are cut short to a maximum of 25ms each. This is necessary for the test duration to be reasonable, but it does mean that drives don't get long stretches of idle time to use for garbage collection and flushing SLC caches. But in aggregate, the drives are still spending a lot more time idle than busy: during a relatively quick 7 hour run of The Destroyer, a fast NVMe SSD will only spend a bit more than 2 hours busy with one or more pending IO operation. The rest of the time is accounted for by a very large number of short idle periods.
| AnandTech Storage Bench IO Traces | ||||||||||||||
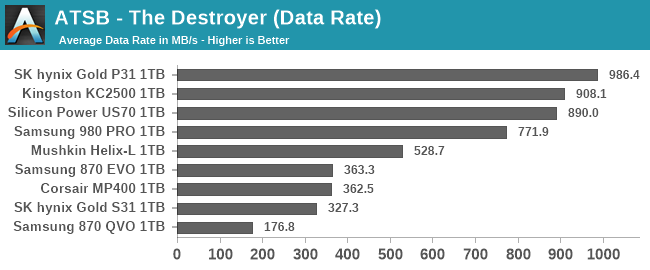
| The Destroyer | Heavy | Light | ||||||||||||
| Reads | 38.83 million | 2.17 million | 373k | |||||||||||
| Writes | 10.98 million | 1.78 million | 460k | |||||||||||
| Total IO Operations | 49.8 million | 3.99 million | 832k | |||||||||||
| Total GB Read | 1583.02 GiB | 48.63 GiB | 17.97 GiB | |||||||||||
| Total GB Written | 875.62 GiB | 106.32 GiB | 23.25 GiB | |||||||||||
| Typical Test Duration | 7 hours (NVMe) 12 hours (SATA) |
1h 15m | 25m | |||||||||||
Aside from the updated hardware and Windows versions, the one big change we're making to how the ATSB tests are run is a change for the sake of better automation. Previously, the drives being tested were secure erased before each ATSB trace playback, and for the Light and Heavy test runs on a full drive we would erase the drive, fill it, then play back the trace. But secure erasing drives is a hassle when Windows is involved, so this meant manually rebooting to Linux five times for the five trace runs. Our new method is to run all the trace tests in sequence: starting from a freshly-erased empty drive, we run the Light test, then the Heavy and The Destroyer, then fill the drive with sequential writes and run the Light and Heavy tests again. This means that our "empty drive" test runs of the Heavy test and The Destroyer are now running on a lightly-(ab)used drive rather than a freshly-erased drive, and that may bring down the scores somewhat. The full drive run of the Heavy test will also be somewhat affected by the mix of IO performed by the preceding Light test that disturbs the preconditioning of the full-drive sequential write pass. This eases our testing process and saves my sanity somewhat.
As always, we're still giving the drives plenty of idle time (10 minutes) between test runs and after the sequential write pass. The speed of today's NVMe drives mean that the automated sequence of running all five stages of the ATSB tests now takes about the same ~12 hours that was average for a SATA drive to complete just The Destroyer. Batching the ATSB tests together makes for more effective time usage when running these tests overnight, and less sleep lost to manual intervention.
The performance scores presented for each ATSB test include the overall average throughput during the test, and several subscores breaking down average and 99th percentile latency for both read and write operations. We also report the total energy usage during the test, which is a good indication of overall efficiency. Low-power drives that take a long time to complete the test and drives that complete it quickly but with high power draw will both suffer in the energy usage rankings.
 |
|||||||||
| Average Data Rate | |||||||||
| Average Latency | Average Read Latency | Average Write Latency | |||||||
| 99th Percentile Latency | 99th Percentile Read Latency | 99th Percentile Write Latency | |||||||
| Energy Usage | |||||||||
 |
|||||||||
| Average Data Rate | |||||||||
| Average Latency | Average Read Latency | Average Write Latency | |||||||
| 99th Percentile Latency | 99th Percentile Read Latency | 99th Percentile Write Latency | |||||||
| Energy Usage | |||||||||
 |
|||||||||
| Average Data Rate | |||||||||
| Average Latency | Average Read Latency | Average Write Latency | |||||||
| 99th Percentile Latency | 99th Percentile Read Latency | 99th Percentile Write Latency | |||||||
| Energy Usage | |||||||||
PCMark 10 Storage Benchmarks
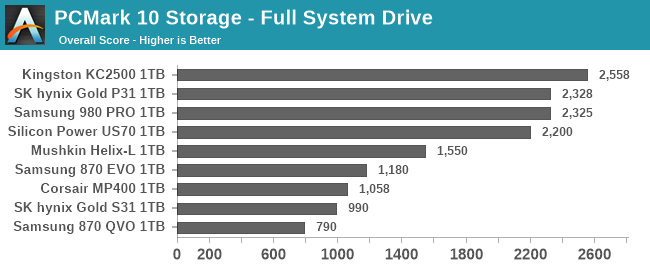
At the end of 2019, UL released a major update to their popular PCMark 10 benchmark suite, adding storage performance tests that had been conspicuously absent for over two years. These new storage benchmarks are similar to our AnandTech Storage Bench (ATSB) tests in that they are composed of traces of real-world IO patterns that are replayed onto the drive under test.
PCMark 10 provides four different storage benchmarks. The Full System Drive, Quick System Drive and Data Drive benchmarks cover similar territory to our ATSB Heavy and Light tests, and all three together take about as long to run as the ATSB Heavy and Light tests combined. The Drive Performance Consistency Test is clearly meant to one-up The Destroyer and also measure the worst-case performance of a drive that is completely full. Due to time constraints, we are not yet attempting to add the Drive Performance Consistency Test to our usual test suite. This is a line we're put in to ensure timely arrival of reviews.
| PCMark 10 Storage Tests | ||
| Test Name | Data Written | |
| Data Drive | 15 GB | |
| Quick System Drive | 23 GB | |
| Full System Drive | 204 GB | |
| Drive Performance Consistency | 23 TB + 3x drive capacity | |
The primary subscores for the PCMark 10 Storage benchmarks are average bandwidth and average latency for read and write IOs. These are combined into an overall score by computing the geometric mean of the bandwidth score and the reciprocal of the latency score.
Full System Drive Benchmark
The Full System Drive Benchmark covers a broad range of everyday tasks: booting Windows and starting applications and games, using Office and Adobe applications, and file management. The "Full" in the name does not mean that each drive is filled or that the entire capacity of the drive is tested. Rather, it only indicates that all of the PCMark 10 Storage sub-tests are included in this test.
 |
|||||||||
| Overall Score | Average Bandwidth | Average Latency | |||||||
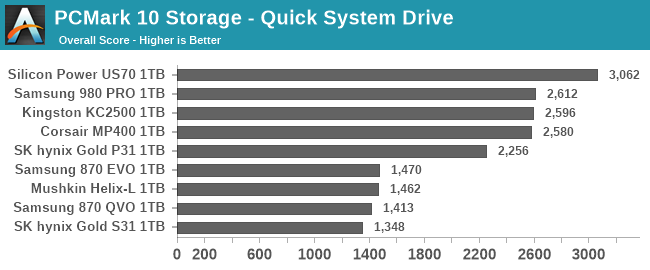
Quick System Drive Benchmark
The Quick System Drive Benchmark is a subset of the Full System Drive Benchmark, running only 6 out of the 23 sub-tests from the Full test.
 |
|||||||||
| Overall Score | Average Bandwidth | Average Latency | |||||||
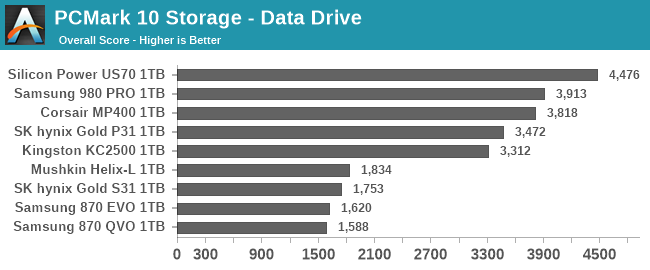
Data Drive Benchmark
The Data Drive Benchmark is intended to represent usage a secondary or portable drive may be subject to. This test simulates copying around files, but does not simulate the IO associated with launching and running applications from a drive.
 |
|||||||||
| Overall Score | Average Bandwidth | Average Latency | |||||||


70 Comments
View All Comments
nobozos - Tuesday, February 2, 2021 - link
One thing that bothers me about benchmarks in general is that they often don't show the statistics normalized against the cost of the thing being measured. For example, I'd like to see iops/$, or GBs/$, or ???/$ in all your tables and charts. I think you've sometime done this in the past, but it should become a regular feature of every review.kepstin - Tuesday, February 2, 2021 - link
Prices are so volatile in the market (and sometimes even regional) that a static number here doesn't make sense imo. The periodic roundups of recommended drives do take price and performance into account.KarlKastor - Tuesday, February 2, 2021 - link
@BillyThank you for the detailed test and the explanation of each procedure.
There is one thing that I am missing in this test. How does a drive perform in heavy and light, if it is 80 or 90% full?
Is it closer to a fresh drive or closer to full drive?
Maybe you can run a drive in that precondition. Not as a general test, but just once to show how a drive behaves.
Oxford Guy - Tuesday, February 2, 2021 - link
Great article. I particularly agree with the use of 80% full because that's a lot more realistic than empty drive testing. In fact, I would skip empty drive testing and stick with 60% and 80% full tests.• Having three Samsung drives out of nine shown seems like an ad for Samsung, even if that wasn't the intention. That Samsung is a popular brand is not a good reason. OCZ used to be popular and the company's bad practices caught up with it.
• Please test the Inland brand drives. People can find Samsung drive tests all over the Internet. I'm not saying don't test them, of course. I am asking that you provide significantly more added value to your SSD reviews by reviewing drives almost no one else reviews. For instance, I recently purchased the 2 TB Inland Performance Plus drive, which uses the Phison E18 controller. It should provide very good performance but reviews would help.
Another issue with brands like Inland is firmware updates. Sandforce, the most infamously poor-quality SSD controller outfit, finally (they claimed) fixed a serious bug in their second-generation controller years ago and OCZ released yet another firmware update. Yet, other brands were sold using the controller and the OCZ tool wouldn't recognize them so they could be patched. Sandforce, of course, never bothered to provide a utility for patching these other brands' drives.
This issue isn't so severe if the consumer just happened to have purchased a Sandforce drive from a vendor that sometimes makes the effort to create patches, like Intel. But, it's really inexcusable to have such a caveat emptor attitude that one doesn't make a strong effort to warn consumers about any risks involved in buying drives from less dominant brands. Phison, for instance, has reportedly been working on improving the firmware for the E18. Will Inland ever receive a patch? I haven't looked much into it but when I did a a few cursory searches about Inland and firmware patches over the years it seemed that it was the typical "off brand" situation — where the drives are stuck forever with their initial firmware.
That's not such a severe problem if the firmware is decent to begin with (unlike OCZ, which, despite dozens of updates never fixed the Vertex 2 drive at all) — but it's something Anandtech should be and should have been raising awareness about. Your site covered OCZ's bait and switch tactics (when it switched 32-bit NAND in the Vertex 2 for 64-bit NAND, causing the drives to brick randomly — especially when put to sleep), which was great.
But, unless I missed it I haven't seen any articles about the drawbacks of purchasing SSDs from smaller brands. And, why not put some pressure on the industry to stop enabling companies like Sandforce to not provide utilities to patch their drives (and utilities to un-brick them when they go into 'panic mode'). It was completely inexcusable — the industry silence around that. Sandforce made it much more important to brick the drive when there was a software glitch, no matter how minor, apparently to 'protect its IP'. Shouldn't the consumer's data be considered the priority? Well, they came out with a not-at-all-conflict-of-interest partnership with DriveSavers. That's right — you get the joy of a drive that will brick at any moment and then you can spend thousands to 'protect the vaunted Sandforce IP' and pad its pockets and DriveSavers'.
The tech press is supposed to protect us from caveat emptor. So, please... start reviewing smaller brands, start providing a bigger picture than the latest from Samsung, and put more pressure on industry players (like Inland) to do the right things, like keeping their drives' firmware current.
Oxford Guy - Tuesday, February 2, 2021 - link
Speaking of bad practices, let's take a look at Samsung.1. The company breaks industry convention and intentionally confuses consumers by labeling QLC drives "MLC", and TLC drives as well. That's an example of fraud which is, unfortunately, legal.
There should have been an article from every tech site condemning this. I don't recall seeing even one. You know, it's not too late, either!
2. The company posted fantasy power consumption figures for drives like the 830 and the tech press and companies like Newegg dutifully posted those specs. Samsung sold a lot of drives based on word of mouth — about how amazingly efficient its drives were, based on those nonsensical power usage claims.
3. The company released its planar TLC drives in such an under-engineered (half-baked) state that they had to be kludged into frequently rewriting stored data to keep their performance somewhat acceptable. The steady state performance of the 128 GB 840 drive earned particular, fully justified, scorn from HardOCP.
Kristian Vättö - Tuesday, February 2, 2021 - link
All SSDs with a Phison controllers are the same - designed and assembled by Phison. Sure, there are some FW differences as every customer can request customisations, but at a high-level an SSD with a Phison controller is a Phison SSD. None of the small brands produce their own SSDs, they simply work with Phison and other similar ODMs who offer turnkey solutions. Anyone can start their own brand if they have enough capital to meet the MOQ requirements.It was different 10 years ago when there were numerous incumbent controller and SSD vendors shipping new designs every 6-12 months ago. At that time, it was never sure what to expect and at AT we were more or less a validation partner even. Nowadays there are a few large factories pumping out stuff with different labels.
Oxford Guy - Tuesday, February 2, 2021 - link
The Sandforce 2200 controller was used by a bunch of different companies but to my knowledge it’s not possible to patch that bug if one owns one of the smaller brands’ drives. It’s unlikely enough to get OCZ’ utility to recognize its own drives, let alone another vendor’s.So, even if the controller is the same and even if the other hardware is standard, is there a standard utility that can be used with any drive made by any brand? Sandforce never seemed to bother to offer anything like that and there were a lot of different brands using its controllers.
Also, even when a controller is standard the firmware may not be, as in the case of Intel’s Sandforce drives as far as I know.
Oxford Guy - Tuesday, February 2, 2021 - link
So my question remains: are all the Inland drives able to be firmware-updated and secure erased?Or, are such ‘small brand’ drives locked out of those things?
rahvin - Tuesday, February 2, 2021 - link
Why would they offer a tool when they can charge the OEM to produce a branded tool for those drives only?There's little incentive for an ODM to provide anything they aren't paid for and their customers aren't the retail buyers, it's the OEM's.
Billy Tallis - Tuesday, February 2, 2021 - link
Samsung's over-represented in this article mainly because they're one of the few companies still sampling new SATA drives for review, and I didn't want to have the SATA market segments represented by old 64-layer drives that you can no longer purchase.As for the Inland drives: I don't have any easy way to get samples of a large number of their drives. I strongly prefer not wasting time re-testing the same drive with a different brand's sticker. I do plan to soon have full results for E12+TLC, E12S+QLC, E16+TLC, E16+QLC drives in Bench, and I'll be getting an E18 sample soon. They won't all be from the same brand, but the results will be generally representative of the equivalents from other Phison-based brands.
I also wish the smaller SSD brands did a better job of making firmware updates available. That is definitely a valid reason for preferring some brands over others. It's a little hard to evaluate vendors on the timeliness of their firmware update releases at product launch, and I've never made it a priority to systematically compare vendors on this post-launch.
Part of why it's been a low priority has been because it seems like firmware updates are generally not as important these days. When a controller is first launched there are often a few updates to optimize performance, but those usually don't have a big impact on the overall standings of a drive. Firmware updates to fix critical bugs seem to be thankfully less common. And for users who really do care about making sure they've got the absolute latest firmware on their Phison drives, you can usually find a way to apply the update using a different vendor's tool—not ideal by any means, but it works.