How We Test PCIe 4.0 Storage: The AnandTech 2021 SSD Benchmark Suite
by Billy Tallis on February 1, 2021 1:15 PM ESTSynthetic Tests: Basic IO Patterns
Our first batch of synthetic benchmarks exercise the four basic IO patterns: random reads, random writes, sequential reads, and sequential writes. These are the figures most often quoted on SSD spec sheets, with the fine print delineating test conditions designed to produce the largest possible numbers. Our tests are intended to reflect more realistic conditions of low queue depths, though we do also include some tests that get up to very high queue depths.
The biggest change here from our previous SSD test suite is that all of these tests are now run twice: first on a mostly-empty drive with the test confined to the first 32GB of the drive, and later with the drive 80% full and the test allowed to touch any part of that 80%. The intention here is to capture some of the impact of SLC caching and DRAMless or reduced-DRAM designs. The test runs given free reign over 80% of the drive will show much less spatial locality than the 32GB range runs, so drives that do not have a full-size DRAM buffer to cache their FTL mapping tables will generally show worse random access performance for the wide-range tests. Running tests with the drive 80% full also means drives with a variable-size SLC cache will have had to shrink the cache size down to its minimum size (or very nearly), which means write tests will be much more likely to overflow what SLC cache remains. Drives that optimistically keep data in their SLC caches to accelerate reads will also tend to suffer on the wide-range tests where most of the data accessed cannot still be in the cache.
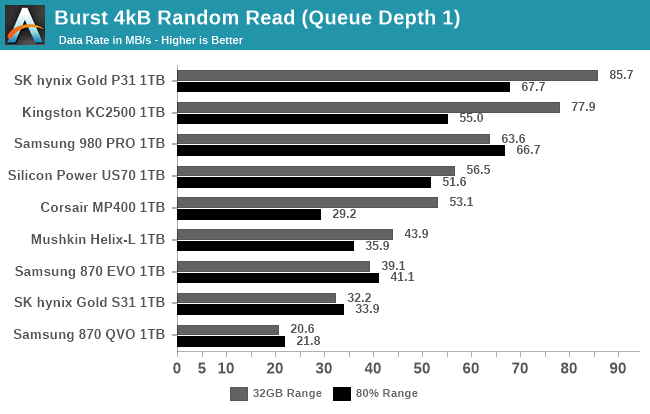
Burst IO Performance
First up, we have a series of tests at queue depth 1 measuring performance on short bursts of IO. The random read and write tests consist of 32 bursts of up to 64MB each. The sequential read and write tests use eight bursts of up to 128MB each. Each burst is limited to a maximum of one second, though that limit should only come into play for particularly slow drives.
Contrary to standard industry practice, these sequential read and write test are configured to perform 1MB operations rather than 128kB. We made this choice because disk traces show that the sequential IO produced by moving large files around with Windows results in 1MB chunks of IO, so these burst sequential IO tests are a decent proxy for simple file copying tests, and are somewhat more representative of real-world IO patterns than issuing 128kB requests one at a time. However, since these tests are run on Linux, the OS will split up these IOs into 128kB segments and issue them to the drive as a batch of 8 commands, although that doesn't much change the chunkiness of the IO. This change to 1 MB is likely to particularly benefit drives optimized for 1 MB chunks, and we've previously noticed a number of popular controllers focusing on this size for IO, despite most spec sheets only focusing on 128 kB.
 |
|||||||||
| Random Read | Random Write | ||||||||
| Sequential Read | Sequential Write | ||||||||
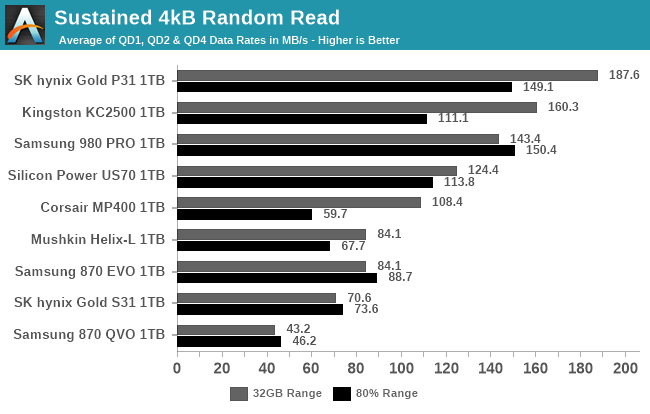
Sustained IO Performance
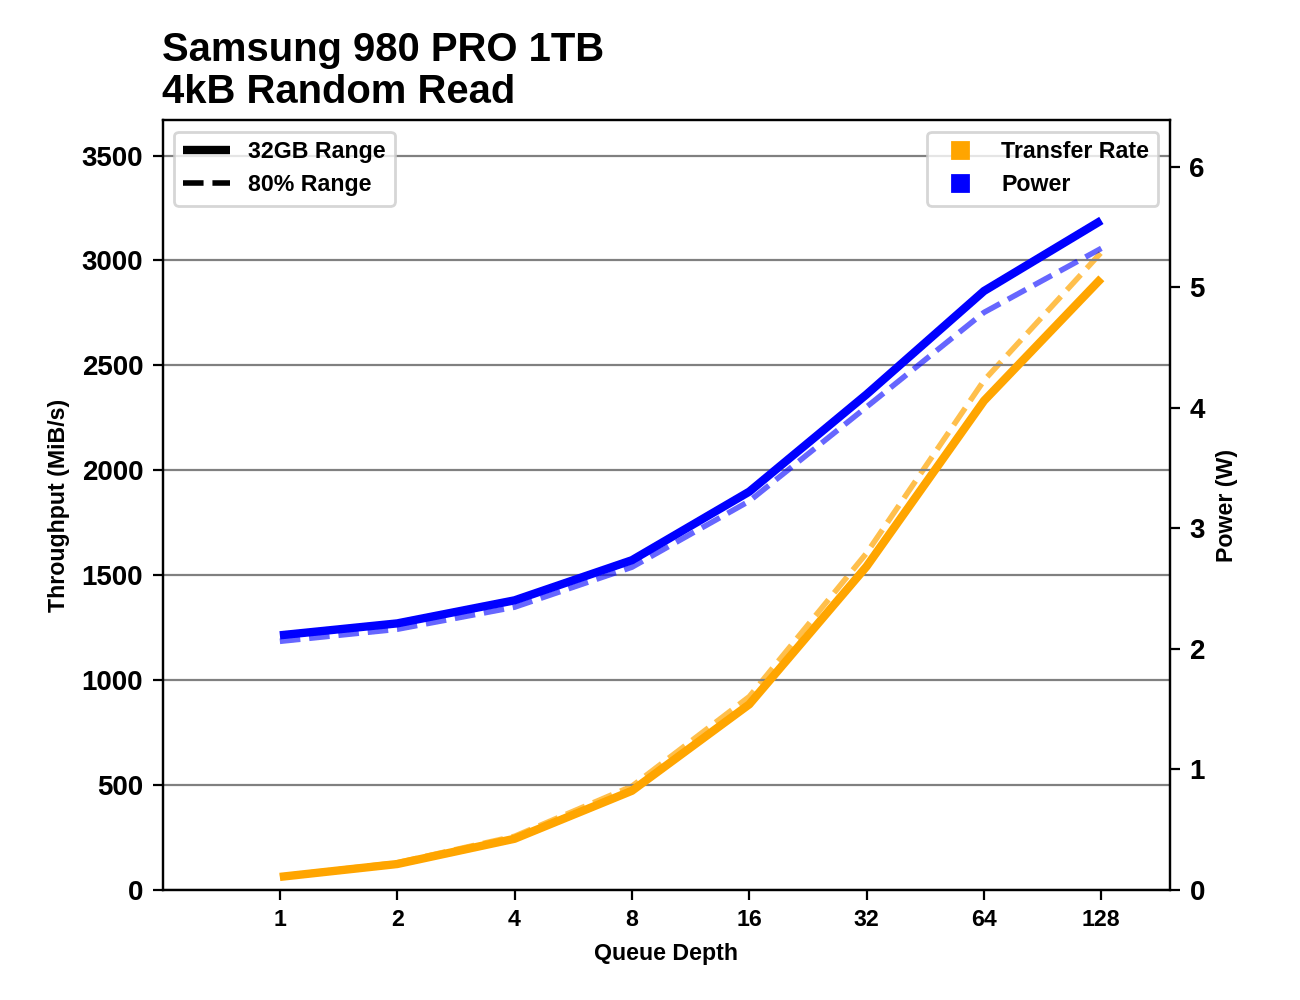
Our sustained IO tests have also changed a bit, aside from the split to test both narrow and wide ranges of the drive. We're still testing the four basic IO patterns at a range of queue depths (now going up to QD128), but placing the most importance on performance at the low queue depth most commonly produced by real-world usage.
Each sub-test is permitted to run for much longer than our burst IO tests, but we still place strict limits on these tests: the test for each queue depth and IO pattern is allowed to transfer up to 16GB, and to run for no more than 30 seconds (sequential IO) or 10 seconds (random IO). After each test that only reads data, the drive is given idle time equal to the duration of the test phase that just completed. After tests that write data, the idle time is five times longer, to allow for the drive's background cleanup processes to make progress. The random read and write tests are multithreaded and will use up to four threads to perform IO, so the QD32 test phase consists of four threads each operating at QD8. The sequential IO tests are all single-threaded regardless of queue depth, and move to a new random location within the test range after each 128MB of IO, in order to avoid constantly hammering the same LBAs on each iteration. (This can be thought of as representing a mild degree of filesystem fragmentation.)
Since these tests run longer than the blink of an eye durations of the burst IO tests, we're able to take meaningful power measurements, and compute power efficiency metrics (performance per Watt) for each test.
The primary scores we report for each test are an average of the measured performance/power/efficiency at queue depths 1, 2 and 4. Weighting those three equally is a fairly arbitrary choice, but we feel it does a fine job of representing a somewhat realistic distribution of queue depths.
 |
|||||||||
| Random Read: | Performance | Power | Efficiency | ||||||
| Random Write: | Performance | Power | Efficiency | ||||||
| Sequential Read: | Performance | Power | Efficiency | ||||||
| Sequential Write: | Performance | Power | Efficiency | ||||||
 |
|||||||||
| Random Read | |||||||||
| Random Write | |||||||||
| Sequential Read | |||||||||
| Sequential Write | |||||||||
Digging into the detailed graphs for each drive shows that the latest high-end NVMe SSDs continue to show increased performance as queue depths climb to insane levels. We could have extended these tests far beyond QD128, but we're already well into the fantasy realm of silly benchmarks. There are also some very striking discrepancies between the narrow 32GB range testing and the 80% full drive testing, especially on the write tests.
Random Read Performance Consistency
Next up is a test borrowed from our enterprise SSD benchmark suite. This test is designed to measure the latency and performance consistency of a drive during sustained random reads. Measuring latency during our other sustained IO tests can produce misleading scores because those tests run at specific fixed queue depths. There are two main problems with this approach. First, if the queue depth is higher than what's necessary to get full performance out of the drive, then every operation will have to wait in the queue for some time before the drive starts working on it. That inflates all the latency metrics by an amount proportional to how much larger the queue depth is than necessary for that particular drive.
The second problem is a bit more subtle. In the real world, new IO requests don't stop showing up just because the drive already has eg. four or eight requests already pending, and if a drive stalls while handling one particular request, new IO commands will build up in the queue. A test that runs at a fixed queue depth will only record a handful of high-latency operations during a performance stall; this is called the coordinated omission problem. The solution is a test that issues IOs at a fixed rate, and lets queue depth be a consequence of the drive's performance.
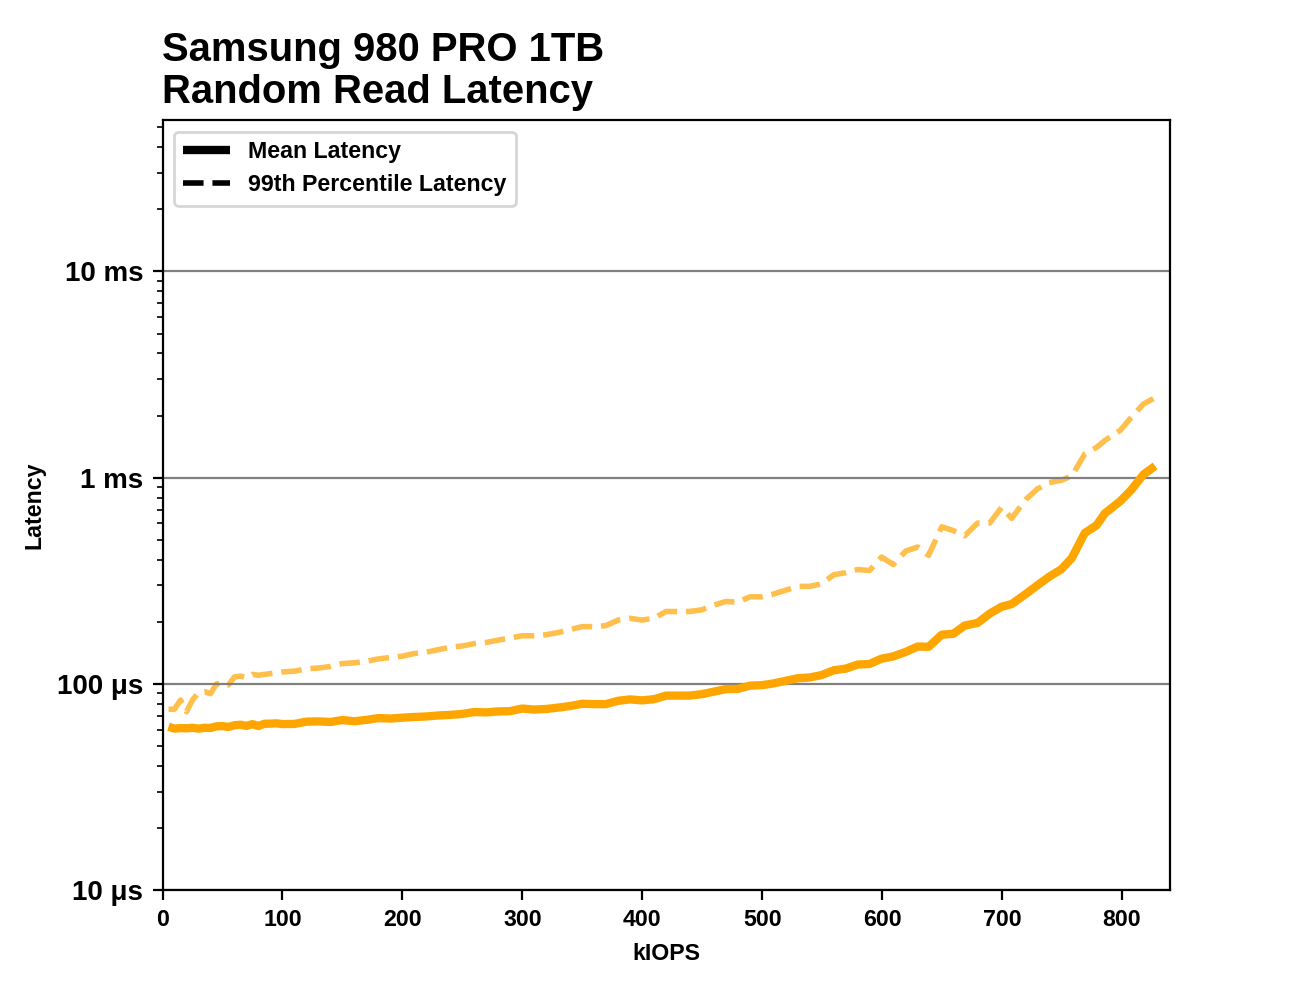
This test issues 4kB random reads at increasing rates until the drive can't keep up. At each rate tested, the test performs 4GB of random reads (split across 4 threads), for a total of just over a million IOs. We report the average and 99th percentile latency at each rate, starting from 5k IOPS and increasing until the drive cannot sustain the requested rate. This test doesn't include any idle time between steps, so toward the end it is considerably more intense than real-world consumer workloads.
This test is only performed for random reads. Sequential reads and writes are usually not so latency-sensitive for consumer workloads: either the software only cares about when the entire sequential transfer is done, or it's streaming data and the application or OS can perform buffering and prefetching in RAM. Random writes can also be buffered in RAM, and SLC caching would give this test messy results on most consumer drives.
 |
|||||||||
Most drives show a gradual increase in latency that becomes much steeper as the test approaches the drive's maximum throughput. The testing doesn't cut off until the drive is delivering at least 5% less than the requested rate, but we cut the graphs off a bit earlier than that: stopping at the last step before the drive's actual (rather than requested) performance is within 1% of its true maximum throughput. Without trimming off the end of the curve, basically every drive's graph would end in a vertical line that distorts the scale of the graph.
Occasionally a drive's performance Quality of Service (QoS) will be bad enough that it fails out of the test early, long before its theoretical throughput limit has been reached. That would be a serious concern for an enterprise drive, but for consumer drives it's only an issue if it happens very early in the test at low speeds. Typical real-world consumer workloads don't produce an uninterrupted stream of random reads like this test, and when a consumer SSD has QoS problems it's usually because some slow write operations are getting in the way of read operations.
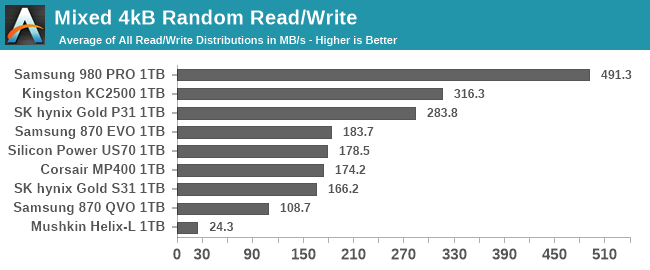
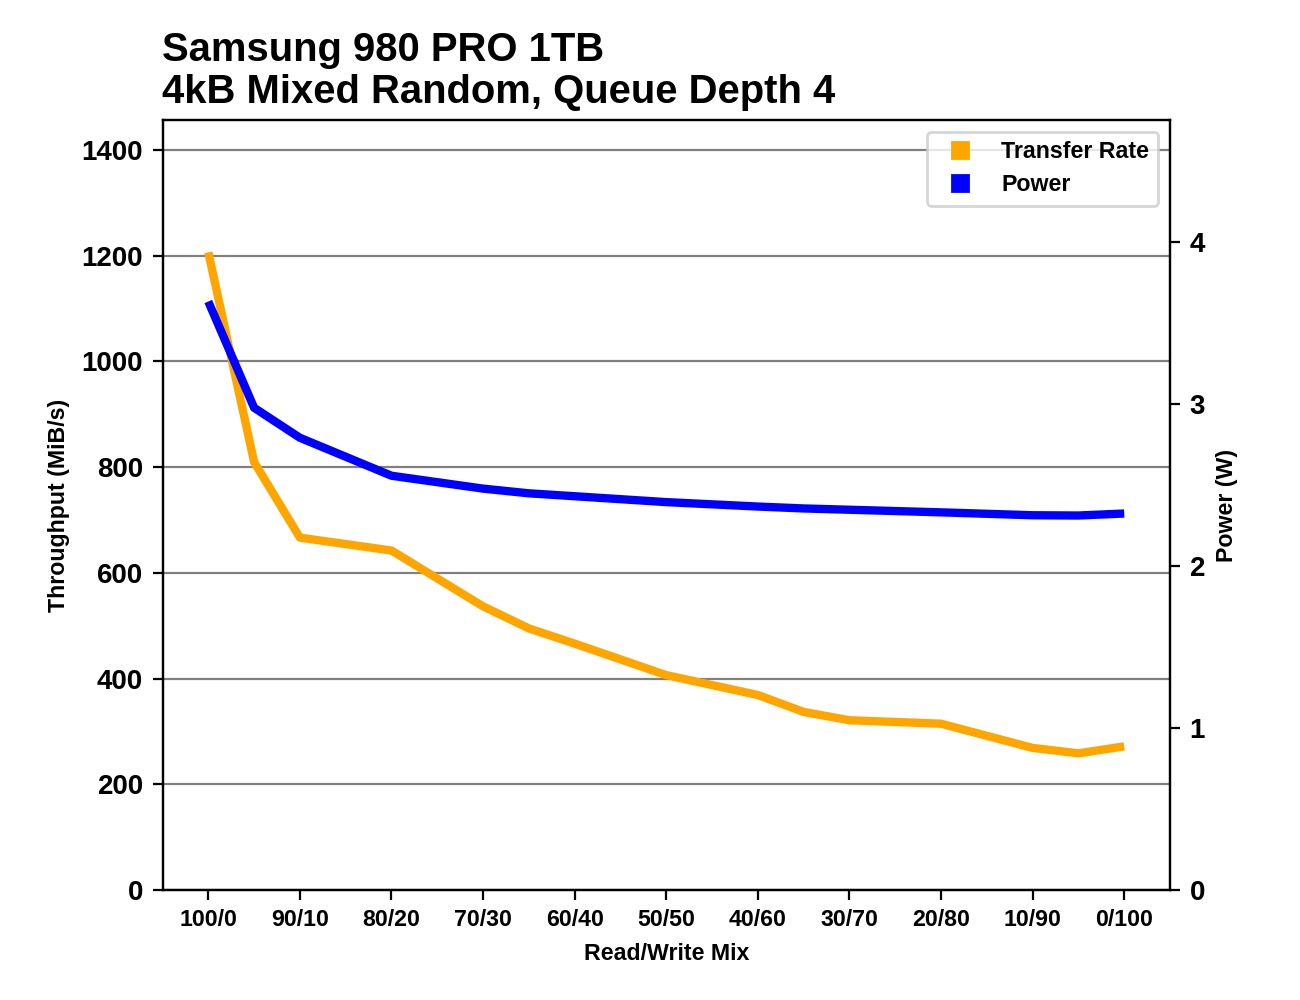
Mixed IO Performance
The trace-based tests in our benchmark suite do a pretty good job of covering realistic patterns of mixed reads and writes. These synthetic tests of varying mixes of reads and writes aren't intended to emulate any particular real-world usage, but are more about observing how performance scales as the balance between reads and writes is adjusted. Most consumer IO tends to involve more reads than writes, but these benchmarks test read-heavy and write-heavy workloads equally.
The changes to our synthetic tests of mixed read/write workloads are similar to the modifications for the other sustained IO tests. However, on this one we're not bothering to split it into versions running against a 32GB slice of the drive and an 80% full drive: the only versions here are the 80% full tests.
Both the mixed sequential and mixed random IO tests use four threads each running at QD1, for a total queue depth of 4. The mixed sequential IO test has been switched to use 1MB operations rather than 128kB, which means there's considerably more data in flight than our old 128kB @ QD1 mixed sequential IO test.
Each workload mix is tested for at most 10 seconds/16GB (random IO) or 30 seconds/16GB (sequential IO). The main scores reported here are averages across all the mixes tested. A good score usually indicates a well-rounded drive that handles write pressure well, but a poor score here doesn't necessarily translate into anything worth worrying about for a consumer.
 |
|||||||||
| Mixed Random IO: | Performance | Power | Efficiency | ||||||
| Mixed Sequential IO: | Performance | Power | Efficiency | ||||||
 |
|||||||||
| Mixed Random IO | |||||||||
| Mixed Sequential IO | |||||||||


70 Comments
View All Comments
Billy Tallis - Monday, February 1, 2021 - link
I set up the testbed with an old 5450 I had lying around, and once all the software was configured I pulled the GPU back out. (That ancient GPU interferes with suspend, which is needed to unlock drives so they can be secure erased.) The system boots without complaint with no GPU, and I use SSH and RDP to run the tests. I'm keeping the 580 in the other system for now because I want to work on getting some application or gaming tests working on that machine when I have spare time.Billy Tallis - Monday, February 1, 2021 - link
I should mention that I have had a bit of trouble booting the ASRock B550 Pro motherboard, because it seems to have half-assed UEFI boot support. The motherboard will forget its boot settings at the slightest provocation, and when that happens it will search for and boot the first Windows it can find. It refuses to detect a Linux bootloader on an internal drive, even if it's in the canonical EFI/Boot/bootx64.efi location on the ESP. So any time this machine decides to forget its boot settings, I have to plug in a GPU and keyboard and boot a Linux off a USB device to re-create the UEFI boot entry for grub.DominionSeraph - Monday, February 1, 2021 - link
This is the power of AMD.Billy Tallis - Monday, February 1, 2021 - link
On the other hand, I was quite surprised to discover that a quad M.2 riser works on this board. Intel would never let PCIe bifurcation be enabled on an entry-level motherboard.Slash3 - Wednesday, February 3, 2021 - link
Asus actually bundles a quad NVMe M.2 adapter with their Strix B550-XE, for some absolutely baffling reason. I tried asking the Asus technical marketing rep on Reddit why they did this, but he didn't understand the question. What a weird friggin decision.https://rog.asus.com/us/motherboards/rog-strix/rog...
frbeckenbauer - Tuesday, February 2, 2021 - link
I have had the same issue on my old ASRock intel board, on my current MSI AMD board, on my Intel laptop, and on my AMD laptop. People really like writing UEFIs that just randomly boot a windows they find for no reasonkepstin - Tuesday, February 2, 2021 - link
I've seen a few AMD boards that have bios options to enable headless operation - basically, setting that option disables the post check for the graphics card. If you're running in native UEFI mode and your operating system doesn't require a GPU, it'll work fine.Makaveli - Monday, February 1, 2021 - link
This was a great article thank you Billy!WaltC - Monday, February 1, 2021 - link
Nice write up...;) Seems rather unsurprising that the two PCIe4 drives running in PCIe4 mode (I gather from the test hardware described) were the best overall performing in your tests. Although you described the PCIe/SATA interfaces of most of the drives--I wasn't clear on the Mushkin or the MP400. Also, a more thorough description of the drivers employed would help--open source or proprietary, etc. Linux distro tests, however, would seem to me to be of somewhat less "practical" value than Win10 tests--considering that Win10 is where the overwhelming bulk of these drives will be deployed by the consumers who buy them, I would think. Overall, it's nice to see changes here in AT's testing methodology!evilspoons - Monday, February 1, 2021 - link
Nice to see another substantial benchmark upgrade, keeping up with this stuff can be mind-boggling at times.The article could use someproofreading though. Even just the first paragraph:
"on accident" -> by accident
"holy unified metric" -> wholly-unified metric
Unless religion is somehow involved in benchmarking SSDs 😉