QLC Goes To 8TB: Samsung 870 QVO and Sabrent Rocket Q 8TB SSDs Reviewed
by Billy Tallis on December 4, 2020 8:00 AM ESTAnandTech Storage Bench - The Destroyer
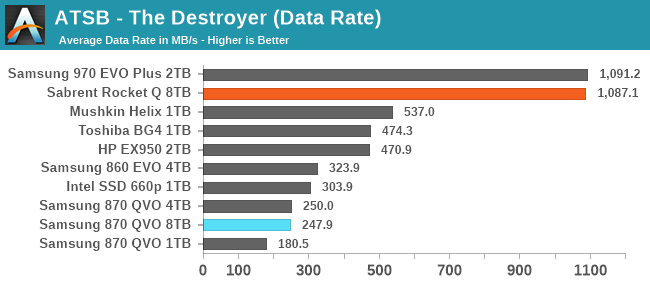
The Destroyer is an extremely long test replicating the access patterns of very IO-intensive desktop usage. A detailed breakdown can be found in this article. Like real-world usage, the drives do get the occasional break that allows for some background garbage collection and flushing caches, but those idle times are limited to 25ms so that it doesn't take all week to run the test. These AnandTech Storage Bench (ATSB) tests do not involve running the actual applications that generated the workloads, so the scores are relatively insensitive to changes in CPU performance and RAM from our new testbed, but the jump to a newer version of Windows and the newer storage drivers can have an impact.
We quantify performance on this test by reporting the drive's average data throughput, the average latency of the I/O operations, and the total energy used by the drive over the course of the test.
 |
|||||||||
| Average Data Rate | |||||||||
| Average Latency | Average Read Latency | Average Write Latency | |||||||
| 99th Percentile Latency | 99th Percentile Read Latency | 99th Percentile Write Latency | |||||||
| Energy Usage | |||||||||
The Sabrent Rocket Q turns in shockingly good scores on The Destroyer, matching the Samsung 970 EVO Plus, a high-end TLC SSD. The reason why the decidedly less high-end Rocket Q can do this is due entirely to the extreme capacity. For the first time, we have a drive that can handle The Destroyer entirely in its SLC cache. That means the results here are a bit misleading, as the drive would not be able to sustain this level of performance if it was full enough to reduce the SLC cache capacity down to more typical sizes. Power efficiency is also pretty decent here, but again operating out of the SLC cache helps.
Meanwhile, the 8TB Samsung 870 QVO turns in pretty much the same performance scores as the 4TB model, as expected. However, the 8TB drive is a little bit more power-hungry due to the higher part count.
AnandTech Storage Bench - Heavy
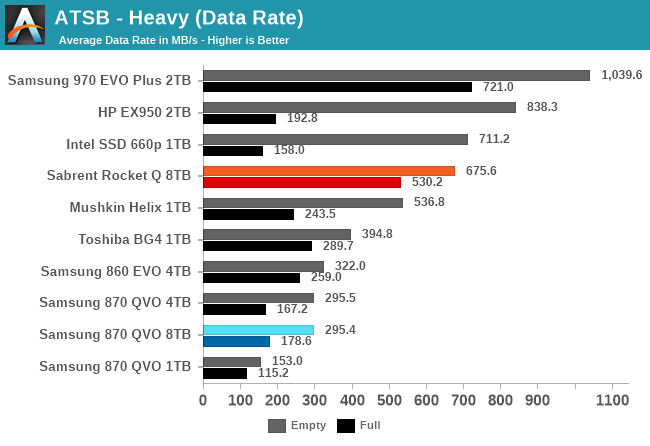
Our Heavy storage benchmark is proportionally more write-heavy than The Destroyer, but much shorter overall. The total writes in the Heavy test aren't enough to fill the drive, so performance never drops down to steady state. This test is far more representative of a power user's day to day usage, and is heavily influenced by the drive's peak performance. The Heavy workload test details can be found here. This test is run twice, once on a freshly erased drive and once after filling the drive with sequential writes.
 |
|||||||||
| Average Data Rate | |||||||||
| Average Latency | Average Read Latency | Average Write Latency | |||||||
| 99th Percentile Latency | 99th Percentile Read Latency | 99th Percentile Write Latency | |||||||
| Energy Usage | |||||||||
The Heavy test doesn't allow the Sabrent Rocket Q a unique advantage from its massive SLC cache; the smaller high-end NVMe drives can also make good use of their caches and overtake the Rocket Q's performance. However, it does appear that the sheer capacity of the 8TB Rocket Q continues to help significantly on the full-drive test runs. We haven't measured it directly, but I suspect the minimum SLC cache size reached when the drive is full is still quite a bit larger than what the 2TB and smaller drives have to work with, and that's how the Rocket Q avoids the horrible latency spikes that the other QLC drives suffer from.
As on The Destroyer, the 8TB Samsung 870 QVO shows no major differences in performance or efficiency from the 4TB model, which means it's still clearly a bit on the slow side even by SATA standards—especially when full.
AnandTech Storage Bench - Light
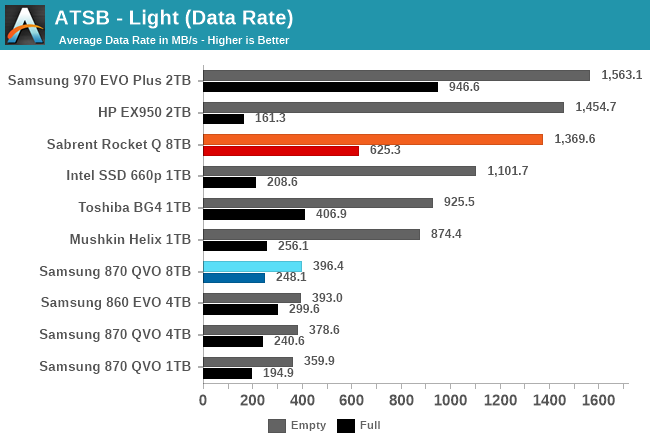
Our Light storage test has relatively more sequential accesses and lower queue depths than The Destroyer or the Heavy test, and it's by far the shortest test overall. It's based largely on applications that aren't highly dependent on storage performance, so this is a test more of application launch times and file load times. This test can be seen as the sum of all the little delays in daily usage, but with the idle times trimmed to 25ms it takes less than half an hour to run. Details of the Light test can be found here. As with the ATSB Heavy test, this test is run with the drive both freshly erased and empty, and after filling the drive with sequential writes.
 |
|||||||||
| Average Data Rate | |||||||||
| Average Latency | Average Read Latency | Average Write Latency | |||||||
| 99th Percentile Latency | 99th Percentile Read Latency | 99th Percentile Write Latency | |||||||
| Energy Usage | |||||||||
The 8TB Sabrent Rocket Q offers decent performance on the Light test, even when full: it still provides a large enough SLC cache to handle all the writes from this test. A lot of smaller drives (using QLC or TLC) can't manage that and show greatly increased write latency on the full-drive test runs.
The 8TB Samsung 870 QVO shows slightly improved latency scores on the full-drive test run compared to the 4TB model, but otherwise performance is the same as expected. As usual, the 8TB QVO is a bit more power-hungry than the smaller versions, and the Rocket Q is considerably more power-hungry than the smaller low-end NVMe drives.


150 Comments
View All Comments
heffeque - Friday, December 4, 2020 - link
"Of course we hope that firmwares don't have such bugs, but how would we know unless someone looked at the numbers?"Well on a traditional HDD you also have to hope that they put Helium in it and not Mustard gas by mistake. It "can" happen, but how would we know if nobody opens every single HDD drive?
In a serious note, if a drive has such a serious firmware bug, rest assured that someone will notice, that it will go public quite fast and that it will end up getting fixed (like it has in the past).
Spunjji - Monday, December 7, 2020 - link
Thanks for responding to that "how do you know unless you look" post appropriately. That kind of woolly thinking really gets my goat.joesiv - Monday, December 7, 2020 - link
Well, I for one would rather not be the one that discovers the bug, and lose my data.I didn't experience this one, but it's an example of a firmware bug:
https://www.engadget.com/2020-03-25-hpe-ssd-bricke...
Where I work, I'm involved in SSD evaluation. A drive we used in the field had a nasty firmware bug, that took out dozens of our SSD's after a couple years of operation (that was well within their specs), The manufacturer fixed it in a firmware update, but not until a year + after release, so we shipped hundreds of product.
Knowing that, I evaluate them now. But for my personal use, where my needs are different, I'd love it if at least a very simple check was done in the reviews. It's not that hard, review the SSD, then check to see if the writes to NAND is reasonable given the workload you gave it. It's right there in the smart data, it'll be in block sizes, so you might have to multiply it by the block size, but it'll tell you a lot.
Just by doing something similar, we were able to vet a drive that was writing 100x more to NAND than it should have been, essentially it was using up it's life expectancy 1% per day! Working with the manufacturer, they eventually decided we should just move to another product, they weren't much into firmware fixes.
Anyways, someone should keep the manufactuers honest, why not start with the reviews?
Also, no offence, but what is the "wolly thinking" are you talking about? I'm just trying to protect my investment and data.
heffeque - Tuesday, December 8, 2020 - link
As if HDD didn't have their share of problems, both firmware and HW (especially the HW). I've seen loads of HDD die in the first 48 hours, then a huge percentage of them no later than a year afterwards.My experience is that SDD last A LOT longer and are A LOT more reliable than HDD.
While HDD had been braking every 1-3 years (and changing them was a high cost due to the remote location, and the high wages of Scandinavian countries), when we changed to SSD we had literally ZERO replacements to perform since then so... can't say that the experience with hundreds of SSD not failing vs hundreds of HDD that barely last a few years goes in favor of HDD in any kind of measure.
In the end, paying to send to those countries a slightly more expensive device (the SSD) has payed for itself several-fold in just a couple of years.
MDD1963 - Friday, December 4, 2020 - link
I've only averaged .8 TB per *month* over 3.5 years....joesiv - Monday, December 7, 2020 - link
Out of curiousity, how did you come to this number?Just be aware that SMART data will track different things. You're probably right, but SMART data is manufactuer and model dependant, and sometimes they'll use the attributes differently. You really have to look up the smart documentation for your drive, to be sure they are calculating and using the attributes the way your smart data utility is labeling them as. Some manfacturers also don't track writes to NAND.
I would look at:
"writes to nand" or "lifetime writes to flash" - which for some kingston drives is attribute 233
"SSD Life Left" - which for some ADATA drives is 232 (ADATA), and Micron/Crucial might be is 202), this is actually usually calculated based on average block erase count against the rated block erase counts the NAND is rated for (3000ish for MLC, much less for 3d nand)
A lot of maufactuers haven't included the actual NAND writes in their SMART data, so it'd be hard to get to, and should be called out for it (Delkin, Crucial).
"Total host writes" is what the OS wrote, and what most viewers assume is what manufactuers are stating when they're talking about drive writes per day or TB a day. That's the amount of data that is fed to the SSD, not what is actually written to NAND.
Also realize that wear leveling routines can eat up SSD life as well. I'm not sure how SLC mode that newer firmwars have affects life expectancy/nand writes actually.
stanleyipkiss - Friday, December 4, 2020 - link
Honestly, if the prices of these QLC high-capacity drives would drop a bit, I would be all over them -- especially for NAS use. I just want to move away from spinning mechanical drives but when I can get a 18 TB drive at the same price of a 4-8 TB SSD, I will choose the larger drive.Just make them cheaper.
Also: I would love HIGHER capacity, and I WOULD pay for it... Micron had some drives and I'm sure some mainstream drives could be made available -- if you can squeeze 8TB onto M.2 then you could certainly put 16TB on a 2.5 inch drive.
DigitalFreak - Monday, December 7, 2020 - link
Ask and ye shall receive.https://www.pcgamer.com/sabrent-is-close-to-launch...
Xex360 - Friday, December 4, 2020 - link
The prices don't make any sense, you can get multiple drives for the same capacity but less money and more performance and reliability, and should cost more because they use more material.inighthawki - Friday, December 4, 2020 - link
At least for the sabrent drive, M.2 slots can be at a premium, so it makes perfect sense for a single drive to cost more than two smaller ones. On many systems being able to hook up that many drives would require a PCIe expansion card, and if you're not just bifurcating an existing 8x or 16x lane you would need a PCIe switch which is going to cost you hundreds of dollars at minimum.