QLC Goes To 8TB: Samsung 870 QVO and Sabrent Rocket Q 8TB SSDs Reviewed
by Billy Tallis on December 4, 2020 8:00 AM ESTAnandTech Storage Bench - The Destroyer
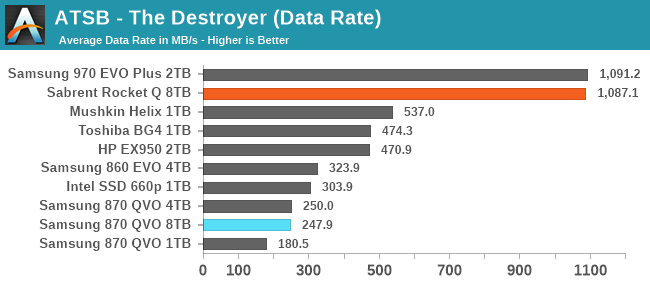
The Destroyer is an extremely long test replicating the access patterns of very IO-intensive desktop usage. A detailed breakdown can be found in this article. Like real-world usage, the drives do get the occasional break that allows for some background garbage collection and flushing caches, but those idle times are limited to 25ms so that it doesn't take all week to run the test. These AnandTech Storage Bench (ATSB) tests do not involve running the actual applications that generated the workloads, so the scores are relatively insensitive to changes in CPU performance and RAM from our new testbed, but the jump to a newer version of Windows and the newer storage drivers can have an impact.
We quantify performance on this test by reporting the drive's average data throughput, the average latency of the I/O operations, and the total energy used by the drive over the course of the test.
 |
|||||||||
| Average Data Rate | |||||||||
| Average Latency | Average Read Latency | Average Write Latency | |||||||
| 99th Percentile Latency | 99th Percentile Read Latency | 99th Percentile Write Latency | |||||||
| Energy Usage | |||||||||
The Sabrent Rocket Q turns in shockingly good scores on The Destroyer, matching the Samsung 970 EVO Plus, a high-end TLC SSD. The reason why the decidedly less high-end Rocket Q can do this is due entirely to the extreme capacity. For the first time, we have a drive that can handle The Destroyer entirely in its SLC cache. That means the results here are a bit misleading, as the drive would not be able to sustain this level of performance if it was full enough to reduce the SLC cache capacity down to more typical sizes. Power efficiency is also pretty decent here, but again operating out of the SLC cache helps.
Meanwhile, the 8TB Samsung 870 QVO turns in pretty much the same performance scores as the 4TB model, as expected. However, the 8TB drive is a little bit more power-hungry due to the higher part count.
AnandTech Storage Bench - Heavy
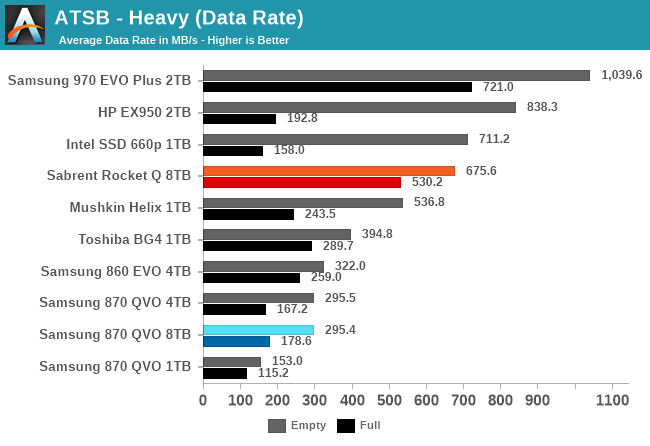
Our Heavy storage benchmark is proportionally more write-heavy than The Destroyer, but much shorter overall. The total writes in the Heavy test aren't enough to fill the drive, so performance never drops down to steady state. This test is far more representative of a power user's day to day usage, and is heavily influenced by the drive's peak performance. The Heavy workload test details can be found here. This test is run twice, once on a freshly erased drive and once after filling the drive with sequential writes.
 |
|||||||||
| Average Data Rate | |||||||||
| Average Latency | Average Read Latency | Average Write Latency | |||||||
| 99th Percentile Latency | 99th Percentile Read Latency | 99th Percentile Write Latency | |||||||
| Energy Usage | |||||||||
The Heavy test doesn't allow the Sabrent Rocket Q a unique advantage from its massive SLC cache; the smaller high-end NVMe drives can also make good use of their caches and overtake the Rocket Q's performance. However, it does appear that the sheer capacity of the 8TB Rocket Q continues to help significantly on the full-drive test runs. We haven't measured it directly, but I suspect the minimum SLC cache size reached when the drive is full is still quite a bit larger than what the 2TB and smaller drives have to work with, and that's how the Rocket Q avoids the horrible latency spikes that the other QLC drives suffer from.
As on The Destroyer, the 8TB Samsung 870 QVO shows no major differences in performance or efficiency from the 4TB model, which means it's still clearly a bit on the slow side even by SATA standards—especially when full.
AnandTech Storage Bench - Light
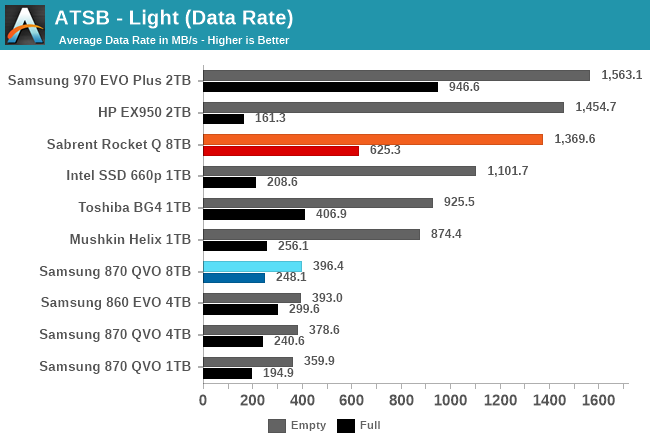
Our Light storage test has relatively more sequential accesses and lower queue depths than The Destroyer or the Heavy test, and it's by far the shortest test overall. It's based largely on applications that aren't highly dependent on storage performance, so this is a test more of application launch times and file load times. This test can be seen as the sum of all the little delays in daily usage, but with the idle times trimmed to 25ms it takes less than half an hour to run. Details of the Light test can be found here. As with the ATSB Heavy test, this test is run with the drive both freshly erased and empty, and after filling the drive with sequential writes.
 |
|||||||||
| Average Data Rate | |||||||||
| Average Latency | Average Read Latency | Average Write Latency | |||||||
| 99th Percentile Latency | 99th Percentile Read Latency | 99th Percentile Write Latency | |||||||
| Energy Usage | |||||||||
The 8TB Sabrent Rocket Q offers decent performance on the Light test, even when full: it still provides a large enough SLC cache to handle all the writes from this test. A lot of smaller drives (using QLC or TLC) can't manage that and show greatly increased write latency on the full-drive test runs.
The 8TB Samsung 870 QVO shows slightly improved latency scores on the full-drive test run compared to the 4TB model, but otherwise performance is the same as expected. As usual, the 8TB QVO is a bit more power-hungry than the smaller versions, and the Rocket Q is considerably more power-hungry than the smaller low-end NVMe drives.


150 Comments
View All Comments
heffeque - Friday, December 4, 2020 - link
No worries on a NAS: BTRFS will take care of that in the background.Billy Tallis - Friday, December 4, 2020 - link
Not sure if that's a joke about BTRFS RAID5/6 ensuring you lose your data.A BTRFS scrub isn't automatic; you need a cron job or similar to automate periodic scrubbing. But assuming you do that and stay away from the more dangerous/less tested RAID modes, you shouldn't have to worry about silent data loss. I've been using BTRFS RAID1 with various SSDs as my primary NAS ever since I amassed enough 1 and 2TB models, and it's worked well so far. ZFS would also work reasonably well, but it is less convenient when you're using a pile of mismatched drives.
Getting back to the question of data retention of QLC itself: the write endurance rating of a drive is supposed to be chosen so that at the end of the rated write endurance the NAND is still healthy enough to provide 1 year unpowered data retention. (For client/consumer drives; for enterprise drives the standard is just 3 months, so they can afford to wear out the NAND a bit further, and that's part of why enterprise drives have higher TBW ratings.)
heffeque - Wednesday, December 9, 2020 - link
BTRFS background self-healing is automatic in Synology as of DSM 6.1 and above.TheinsanegamerN - Saturday, December 5, 2020 - link
Long term cold storage of any flash memory is terrible. QLC wont be any better then TLC in this regard.Oxford Guy - Sunday, December 6, 2020 - link
How could it possibly be better (than 3D TLC)?It can only be worse unless the TLC is really shoddy quality. This is because it has 16 voltage states rather than 8.
TheinsanegamerN - Monday, December 7, 2020 - link
Hence why I said it wont be any better, because it cant be. That leaves the door open for it to be worse.Reeding iz hard.
Oxford Guy - Monday, December 7, 2020 - link
But your comment obviously wasn't clear enough, was it?QLC is worse than TLC. Next time write that since that's the clear truth, not that QLC and TLC are somehow equivalent.
joesiv - Friday, December 4, 2020 - link
I love the idea of 8TB SSD drives, it's the perfect size for a local data drive, I could finally be rid of my spinning rust! Just need the price to drop a bit, maybe next year!Thank you for the review. Though I wish reviews of SSD's would be more clear to consumers what endurance really means to the end user. "DWPD" and TB/D, are mentioned, noone seems to highlight the fact that, it's not end user's writes that matter in these specifications, it's "writes to nand", which can be totally different from user/OS writes. It is reliant on the firmware, and some firmwares do some wonky things for data collection, speed, or even have bugs, which drastically drop the endurance of a drive.
Of course I would love an exhaustive endrance test in the review, at the bare minimum, if anandtech could check the smart data after the benchmark is done, and verify two things, it would give you some useful information.
Check:
- nand writes (average block erases is usually available)
- OS writes (sometimes is not easily available), but since you run a standardized bench suite, perhaps you have an idea of how many GB's you typically run through your drives anyways.
You might need to do a bit of math on the block erase count, to get it back to GBs, and you might need to contact the manufacturer for SMART data attribute documentation, but if they don't have good smart data attributes, or documentation available, perhaps it's something to highlight in the review.
But then you could weed out, and present to the consumer drives that have firmwares have outrageously inefficient nand write patterns.
My company has had several failures, and because of that, have had to test in this way potential drives for our products, and have had to outright skip drives that's specs were great, but the firmwares were doing very inefficient drive writes, limiting their endurance.
anyways, feedback, and fingers crossed!
Keep up the good work, and thanks for the quality content!
heffeque - Friday, December 4, 2020 - link
Well... 2 TB per day every day seems like a lot of writes. Not sure it'll be a problem for normal use.joesiv - Friday, December 4, 2020 - link
well firmware bugs can cause writes to be magnified 10x, 100x higher than what is expected. I've seen it. So, you're 2TB's, would just be 20GB's... Of course we hope that firmwares don't have such bugs, but how would we know unless someone looked at the numbers?