QLC Goes To 8TB: Samsung 870 QVO and Sabrent Rocket Q 8TB SSDs Reviewed
by Billy Tallis on December 4, 2020 8:00 AM ESTPCMark 10 Storage Benchmarks
At the end of 2019, UL released a major update to their popular PCMark 10 benchmark suite, adding storage performance tests that had been conspicuously absent for over two years. These new storage benchmarks are similar to our AnandTech Storage Bench (ATSB) tests in that they are composed of traces of real-world IO patterns that are replayed onto the drive under test. We're incorporating these into our new SSD test suite, and including our first batch of results here.
PCMark 10 provides four different storage benchmarks. The Full System Drive, Quick System Drive and Data Drive benchmarks cover similar territory to our ATSB Heavy and Light tests, and all three together take about as long to run as the ATSB Heavy and Light tests combined. The Drive Performance Consistency Test is clearly meant to one-up The Destroyer and also measure the worst-case performance of a drive that is completely full. Due to time constraints, we are not yet attempting to add the Drive Performance Consistency Test to our usual test suite.
| PCMark 10 Storage Tests | ||
| Test Name | Data Written | |
| Data Drive | 15 GB | |
| Quick System Drive | 23 GB | |
| Full System Drive | 204 GB | |
| Drive Performance Consistency | 23 TB + 3x drive capacity | |
The primary subscores for the PCMark 10 Storage benchmarks are average bandwidth and average latency for read and write IOs. These are combined into an overall score by computing the geometric mean of the bandwidth score and the reciprocal of the latency score. PCMark 10 also records more detailed statistics, but we'll dig into those in a later review. These PCMark 10 Storage test runs were conducted on our Coffee Lake testbed:
| AnandTech Coffee Lake SSD Testbed | |
| CPU | Intel Core i7-8700K |
| Motherboard | Gigabyte Aorus H370 Gaming 3 WiFi |
| Chipset | Intel H370 |
| Memory | 2x 8GB Kingston DDR4-2666 |
| Case | In Win C583 |
| Power Supply | Cooler Master G550M |
| OS | Windows 10 64-bit, version 2004 |
Data Drive Benchmark
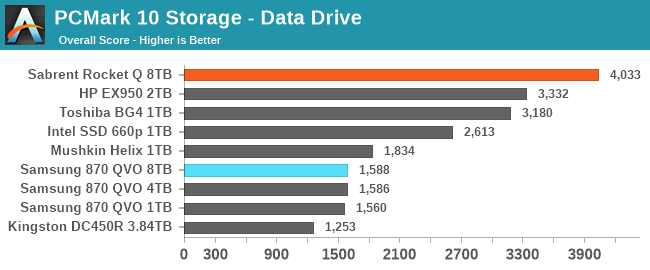
The Data Drive Benchmark is intended to represent usage a secondary or portable drive may be subject to. This test simulates copying around files, but does not simulate the IO associated with launching and running applications from a drive.
 |
|||||||||
| Overall Score | Average Bandwidth | Average Latency | |||||||
Starting off, the 8TB Sabrent Rocket Q leads the field thanks to its massive and fast SLC cache; it clearly outperforms even the decently high-end 2TB TLC-based HP EX920. The several capacities of the Samsung 870 QVO all performa about the same: less than half the speed of the faster NVMe drives, and slower than the slowest entry-level NVMe drives. The enterprise SATA drive with no SLC caching comes in last place.
Quick System Drive Benchmark
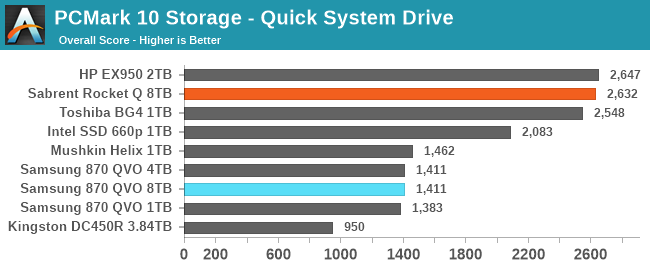
The Quick System Drive Benchmark is a subset of the Full System Drive Benchmark, running only 6 out of the 23 sub-tests from the Full test.
 |
|||||||||
| Overall Score | Average Bandwidth | Average Latency | |||||||
Moving on to the Quick test, the Sabrent Rocket Q no longer stands out ahead of the other NVMe drives, but still offers decent performance. The performance gap between the NVMe drives and the Samsung 870 QVO drives has narrowed slightly, but is still almost a factor of two.
Full System Drive Benchmark
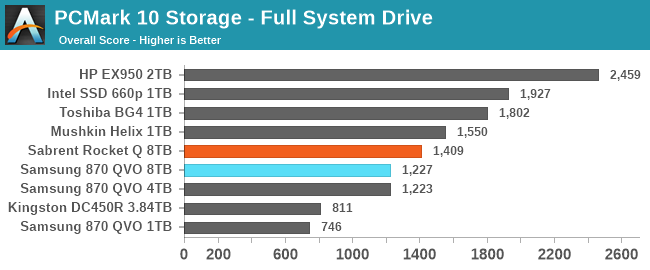
The Full System Drive Benchmark covers a broad range of everyday tasks: booting Windows and starting applications and games, using Office and Adobe applications, and file management. The "Full" in the name does not mean that each drive is filled or that the entire capacity of the drive is tested. Rather, it only indicates that all of the PCMark 10 Storage sub-tests are included in this test.
 |
|||||||||
| Overall Score | Average Bandwidth | Average Latency | |||||||
The Full test starts to bring the downsides of QLC NAND into focus. The Sabrent Rocket Q is now the slowest of the NVMe drives, only moderately faster than the 8TB Samsung 870 QVO. The 1TB 870 QVO is also falling behind the larger and faster models. However, the QLC-based Intel 660p manages to hold on to decent performance, possibly a result of the class-leading SLC cache performance we usually see from Silicon Motion NVMe controllers paired with Intel/Micron flash.


150 Comments
View All Comments
Great_Scott - Sunday, December 6, 2020 - link
QLC remains terrible and the price delta between the worst and good drives remains $5.The most interesting part of this review is how insanely good the performance of the DRAMless Mushkin drive is.
ksec - Friday, December 4, 2020 - link
I really wish a segment of market move towards high capacity and low speed like QVO This is going to be useful for like NAS, where the speed is limited to 1Gbps or 2.5Gbps Ethernet.The cheapest SSD I saw for 2TB was a one off deal from Sandisk at $159. I wonder when we could see that being the norm if not even lower.
Oxford Guy - Friday, December 4, 2020 - link
I wish QLC wouldn't be pushed on us because it ruins the economy of scale for 3D TLC. 3D TLC drives could have been offered in better capacities but QLC is attractive to manufacturers for margin. Too bad for us that it has so many drawbacks.SirMaster - Friday, December 4, 2020 - link
People said the same thing when they moved from SLC to MLC, and again from MLC to TLC.emn13 - Saturday, December 5, 2020 - link
There is an issue of decreasing returns, however.SLC -> MLC allowed for 2x capacity (minus some overhead) I don't remember anybody gnashing their teeth to much at that.
MLC -> TLC allowed for 1.5x capacity (minus some overhead). That's not a bad deal, but it's not as impressive anymore.
TLC -> QLC allows for 1.33x capacity (minor some overhead). That's starting to get pretty slim pickings.
Would you rather have a 4TB QLC drive, or a 3TB TLC drive? that's the trade-off - and I wish sites would benchmark drives at higher fill rates, so it'd be easier to see more real-world performance.
at_clucks - Friday, December 11, 2020 - link
@SirMaster, "People said the same thing when they moved from SLC to MLC, and again from MLC to TLC."You know you're allowed to change your mind and say no, right? Especially since some transitions can be acceptable, and others less so.
The biggest thing you're missing is that the theoretical difference between TLC and QLC is bigger than the difference between SLC and TLC. Where SLC hasto discriminate between 2 levels of charge, TLC has to discriminate between 8, and QLC between 16.
Doesn't this sound like a "you were ok with me kissing you so you definitely want the D"? When TheinsanegamerN insists ATers are "techies" and they "understand technology" I'll have this comment to refer him to.
magreen - Friday, December 4, 2020 - link
Why is that useful for NAS? A hard drive will saturate that network interface.RealBeast - Friday, December 4, 2020 - link
Yup, my eight drive RAID 6 runs about 750MB/sec for large sequential transters over SFP+ to my backup array. No need for SSDs and I certainly couldn't afford them -- the 14TB enterprise SAS drives I got were only $250 each in the early summer.nagi603 - Friday, December 4, 2020 - link
Not if it's a 10G linkleexgx - Saturday, December 5, 2020 - link
If you have enough drives in RAID6 you can come close to saturate a 10gb link (read post above 750MB/s with 8 hdds in RAID6)