QLC Goes To 8TB: Samsung 870 QVO and Sabrent Rocket Q 8TB SSDs Reviewed
by Billy Tallis on December 4, 2020 8:00 AM ESTAnandTech Storage Bench - The Destroyer
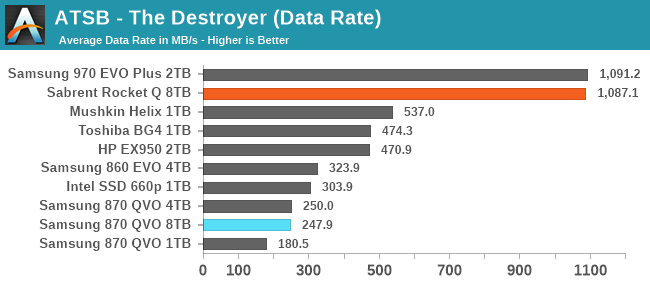
The Destroyer is an extremely long test replicating the access patterns of very IO-intensive desktop usage. A detailed breakdown can be found in this article. Like real-world usage, the drives do get the occasional break that allows for some background garbage collection and flushing caches, but those idle times are limited to 25ms so that it doesn't take all week to run the test. These AnandTech Storage Bench (ATSB) tests do not involve running the actual applications that generated the workloads, so the scores are relatively insensitive to changes in CPU performance and RAM from our new testbed, but the jump to a newer version of Windows and the newer storage drivers can have an impact.
We quantify performance on this test by reporting the drive's average data throughput, the average latency of the I/O operations, and the total energy used by the drive over the course of the test.
 |
|||||||||
| Average Data Rate | |||||||||
| Average Latency | Average Read Latency | Average Write Latency | |||||||
| 99th Percentile Latency | 99th Percentile Read Latency | 99th Percentile Write Latency | |||||||
| Energy Usage | |||||||||
The Sabrent Rocket Q turns in shockingly good scores on The Destroyer, matching the Samsung 970 EVO Plus, a high-end TLC SSD. The reason why the decidedly less high-end Rocket Q can do this is due entirely to the extreme capacity. For the first time, we have a drive that can handle The Destroyer entirely in its SLC cache. That means the results here are a bit misleading, as the drive would not be able to sustain this level of performance if it was full enough to reduce the SLC cache capacity down to more typical sizes. Power efficiency is also pretty decent here, but again operating out of the SLC cache helps.
Meanwhile, the 8TB Samsung 870 QVO turns in pretty much the same performance scores as the 4TB model, as expected. However, the 8TB drive is a little bit more power-hungry due to the higher part count.
AnandTech Storage Bench - Heavy
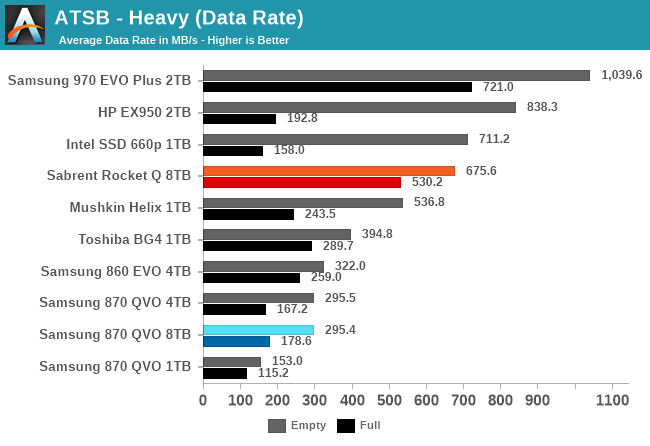
Our Heavy storage benchmark is proportionally more write-heavy than The Destroyer, but much shorter overall. The total writes in the Heavy test aren't enough to fill the drive, so performance never drops down to steady state. This test is far more representative of a power user's day to day usage, and is heavily influenced by the drive's peak performance. The Heavy workload test details can be found here. This test is run twice, once on a freshly erased drive and once after filling the drive with sequential writes.
 |
|||||||||
| Average Data Rate | |||||||||
| Average Latency | Average Read Latency | Average Write Latency | |||||||
| 99th Percentile Latency | 99th Percentile Read Latency | 99th Percentile Write Latency | |||||||
| Energy Usage | |||||||||
The Heavy test doesn't allow the Sabrent Rocket Q a unique advantage from its massive SLC cache; the smaller high-end NVMe drives can also make good use of their caches and overtake the Rocket Q's performance. However, it does appear that the sheer capacity of the 8TB Rocket Q continues to help significantly on the full-drive test runs. We haven't measured it directly, but I suspect the minimum SLC cache size reached when the drive is full is still quite a bit larger than what the 2TB and smaller drives have to work with, and that's how the Rocket Q avoids the horrible latency spikes that the other QLC drives suffer from.
As on The Destroyer, the 8TB Samsung 870 QVO shows no major differences in performance or efficiency from the 4TB model, which means it's still clearly a bit on the slow side even by SATA standards—especially when full.
AnandTech Storage Bench - Light
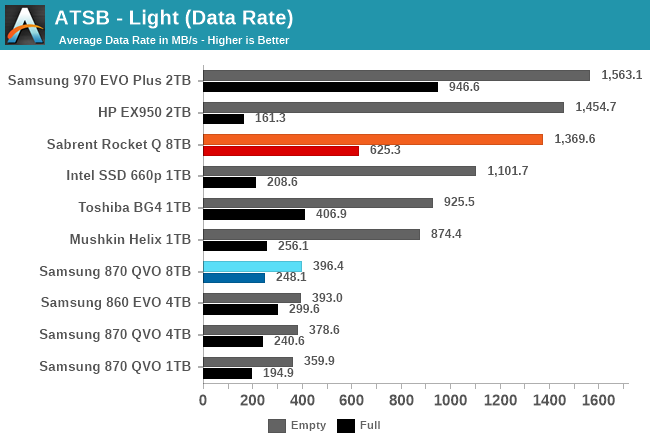
Our Light storage test has relatively more sequential accesses and lower queue depths than The Destroyer or the Heavy test, and it's by far the shortest test overall. It's based largely on applications that aren't highly dependent on storage performance, so this is a test more of application launch times and file load times. This test can be seen as the sum of all the little delays in daily usage, but with the idle times trimmed to 25ms it takes less than half an hour to run. Details of the Light test can be found here. As with the ATSB Heavy test, this test is run with the drive both freshly erased and empty, and after filling the drive with sequential writes.
 |
|||||||||
| Average Data Rate | |||||||||
| Average Latency | Average Read Latency | Average Write Latency | |||||||
| 99th Percentile Latency | 99th Percentile Read Latency | 99th Percentile Write Latency | |||||||
| Energy Usage | |||||||||
The 8TB Sabrent Rocket Q offers decent performance on the Light test, even when full: it still provides a large enough SLC cache to handle all the writes from this test. A lot of smaller drives (using QLC or TLC) can't manage that and show greatly increased write latency on the full-drive test runs.
The 8TB Samsung 870 QVO shows slightly improved latency scores on the full-drive test run compared to the 4TB model, but otherwise performance is the same as expected. As usual, the 8TB QVO is a bit more power-hungry than the smaller versions, and the Rocket Q is considerably more power-hungry than the smaller low-end NVMe drives.


150 Comments
View All Comments
TheinsanegamerN - Monday, December 7, 2020 - link
"50% of people know what QLC means? Is that a joke? 50% of ATers don't understand what that means"Care to back up your staement with evidence? AT is mostly perused by techie people who understand the difference between SLC, MLC, TLC, and QLC.
at_clucks - Wednesday, December 9, 2020 - link
@TheinsanegamerN, yeah, you're swimming in the evidence. Check out the comment section carefully and you'll see how well the average ATer understands this. Some may know something about "bits per cell, whatever that means", some may know it's less reliable because "it wears out faster whatever that means", so they know the marketing concepts but not what lies underneath them. Most will blindly assume SLC > MLC > TLC > QLC not why or how, not what the cell is, how it works, how many levels of charge it can have, how it's read or how it's written, how they're organized, not the impact of the implementation, controller, firmware, OS, not why exactly wear is a thing, not why writes wear the cell but reads aren't an issue, not what planar/2D vs. 3D means, etc. Being a "techie" today means you *buy* a lot of tech and gloss over some articles with bar charts of which product is faster. That's it.If you want me to give "evidence" of every statement I make prepare to provide answers that have enough references in the footnote to look like a PhD thesis.
In the meantime it's all but guaranteed that a regular consumer has no clue what QLC means or that the product name is a reference to QLC. They see an SSD that fits their computer, has a certain capacity, and costs a certain price. Maybe the manufacturer on the label alleviates their concerns.
Knowing QLC has less endurance than SLC ("wears out") or that this is slower than that doesn't mean you understand the tech more than knowing some cars drive faster than others or have lower safety ratings makes you a piston head or mechanic.
ripbeefbone - Friday, December 11, 2020 - link
you're way too onlineOxford Guy - Sunday, December 6, 2020 - link
In large part because product pushers like slickdeals don't list the type of NAND in the listing title.This is the opposite of how manufacturers wanted to use LED to push TV sales so LED was always listed in product listings.
People become aware of what manufacturers want them to become aware of. That's why we have so many marketing programs generating graduates all over the world.
Samus - Sunday, December 6, 2020 - link
Fortunately we know, and we know to stay away from this crap at this price. An 8TB 870 EVO is "worth" $600 to me and that's all I'm willing to pay for a drive that should logically cost much less than 8x1TB SSD's, not the SAME EXACT PRICE at 8x1TB SSD's (the 870 QVO 1TB regularly sells for $80-$90, and is currently $90 at Best Buy.Using Samsung's metric to scale, an 8TB hard drive should cost $400. The controller, DRAM and overall package are the same between drives. The only difference is platters\NAND.
Oxford Guy - Tuesday, December 8, 2020 - link
We knowing is irrelevant because consumer ignorance working in manufacturers’ favor is about the bulk of consumer demand not a small number of people who make extra effort to learn specs manufacturers don’t want us to know about and therefore choose to not push.Oxford Guy - Sunday, December 6, 2020 - link
"Every one of those deals has people saying no to QLC."Apples and oranges. The listing titles don't list the type of NAND.
Oxford Guy - Sunday, December 6, 2020 - link
There is also the trick of them calling TLC and QLC "MLC". Technically, it is multi-layer NAND so they can get away with it, even though it is completely shady.shabby - Sunday, December 6, 2020 - link
First company to do that will be stoned to death.Samus - Monday, December 7, 2020 - link
Do you really think the 860 EVO is MLC like it is advertised as? No, “3-bit” VNAND or more commonly known as TLC. Samsung has been calling TLC [MLC] for years and has it been stoned to death yet.