QLC Goes To 8TB: Samsung 870 QVO and Sabrent Rocket Q 8TB SSDs Reviewed
by Billy Tallis on December 4, 2020 8:00 AM ESTAnandTech Storage Bench - The Destroyer
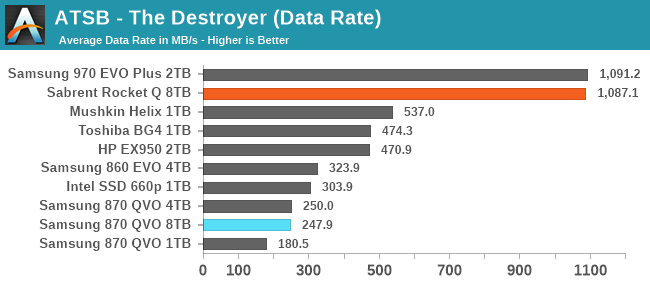
The Destroyer is an extremely long test replicating the access patterns of very IO-intensive desktop usage. A detailed breakdown can be found in this article. Like real-world usage, the drives do get the occasional break that allows for some background garbage collection and flushing caches, but those idle times are limited to 25ms so that it doesn't take all week to run the test. These AnandTech Storage Bench (ATSB) tests do not involve running the actual applications that generated the workloads, so the scores are relatively insensitive to changes in CPU performance and RAM from our new testbed, but the jump to a newer version of Windows and the newer storage drivers can have an impact.
We quantify performance on this test by reporting the drive's average data throughput, the average latency of the I/O operations, and the total energy used by the drive over the course of the test.
 |
|||||||||
| Average Data Rate | |||||||||
| Average Latency | Average Read Latency | Average Write Latency | |||||||
| 99th Percentile Latency | 99th Percentile Read Latency | 99th Percentile Write Latency | |||||||
| Energy Usage | |||||||||
The Sabrent Rocket Q turns in shockingly good scores on The Destroyer, matching the Samsung 970 EVO Plus, a high-end TLC SSD. The reason why the decidedly less high-end Rocket Q can do this is due entirely to the extreme capacity. For the first time, we have a drive that can handle The Destroyer entirely in its SLC cache. That means the results here are a bit misleading, as the drive would not be able to sustain this level of performance if it was full enough to reduce the SLC cache capacity down to more typical sizes. Power efficiency is also pretty decent here, but again operating out of the SLC cache helps.
Meanwhile, the 8TB Samsung 870 QVO turns in pretty much the same performance scores as the 4TB model, as expected. However, the 8TB drive is a little bit more power-hungry due to the higher part count.
AnandTech Storage Bench - Heavy
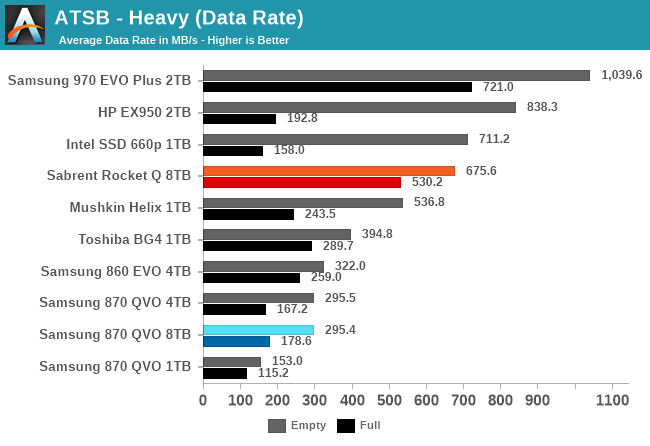
Our Heavy storage benchmark is proportionally more write-heavy than The Destroyer, but much shorter overall. The total writes in the Heavy test aren't enough to fill the drive, so performance never drops down to steady state. This test is far more representative of a power user's day to day usage, and is heavily influenced by the drive's peak performance. The Heavy workload test details can be found here. This test is run twice, once on a freshly erased drive and once after filling the drive with sequential writes.
 |
|||||||||
| Average Data Rate | |||||||||
| Average Latency | Average Read Latency | Average Write Latency | |||||||
| 99th Percentile Latency | 99th Percentile Read Latency | 99th Percentile Write Latency | |||||||
| Energy Usage | |||||||||
The Heavy test doesn't allow the Sabrent Rocket Q a unique advantage from its massive SLC cache; the smaller high-end NVMe drives can also make good use of their caches and overtake the Rocket Q's performance. However, it does appear that the sheer capacity of the 8TB Rocket Q continues to help significantly on the full-drive test runs. We haven't measured it directly, but I suspect the minimum SLC cache size reached when the drive is full is still quite a bit larger than what the 2TB and smaller drives have to work with, and that's how the Rocket Q avoids the horrible latency spikes that the other QLC drives suffer from.
As on The Destroyer, the 8TB Samsung 870 QVO shows no major differences in performance or efficiency from the 4TB model, which means it's still clearly a bit on the slow side even by SATA standards—especially when full.
AnandTech Storage Bench - Light
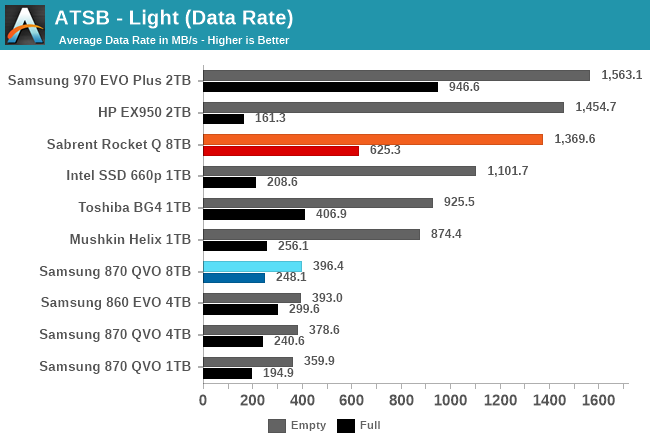
Our Light storage test has relatively more sequential accesses and lower queue depths than The Destroyer or the Heavy test, and it's by far the shortest test overall. It's based largely on applications that aren't highly dependent on storage performance, so this is a test more of application launch times and file load times. This test can be seen as the sum of all the little delays in daily usage, but with the idle times trimmed to 25ms it takes less than half an hour to run. Details of the Light test can be found here. As with the ATSB Heavy test, this test is run with the drive both freshly erased and empty, and after filling the drive with sequential writes.
 |
|||||||||
| Average Data Rate | |||||||||
| Average Latency | Average Read Latency | Average Write Latency | |||||||
| 99th Percentile Latency | 99th Percentile Read Latency | 99th Percentile Write Latency | |||||||
| Energy Usage | |||||||||
The 8TB Sabrent Rocket Q offers decent performance on the Light test, even when full: it still provides a large enough SLC cache to handle all the writes from this test. A lot of smaller drives (using QLC or TLC) can't manage that and show greatly increased write latency on the full-drive test runs.
The 8TB Samsung 870 QVO shows slightly improved latency scores on the full-drive test run compared to the 4TB model, but otherwise performance is the same as expected. As usual, the 8TB QVO is a bit more power-hungry than the smaller versions, and the Rocket Q is considerably more power-hungry than the smaller low-end NVMe drives.


150 Comments
View All Comments
Scour - Monday, December 7, 2020 - link
After experiences which some QLC-SSDs from Samsung and Crucial I have to say: Stay away from QLC if you want performance.Maybe it´s OK for ppl who install a windows and store some music or photos on it, but if you want to write larger amount of data you will be faster with HDDs.
It´s a shame that some ppl recommend a QVO because it have a Samsung-controller and DRAM. Don´t agree with them because some cheap TLC-SSDs are much faster.
Oxford Guy - Monday, December 7, 2020 - link
Samsung is often overrated anyway. Their planar TLC drives were so poorly made that they have to periodically rewrite the data that's on the drive to maintain decent performance.I also remember the company's completely bogus power consumption claims, claims that were taken as truth by consumers who would recommend the drives based on the deception.
Scour - Tuesday, December 8, 2020 - link
My 840 (first version) never was good, it was slower than some of my cheapest SSDs in daily use. I use it now for video-recording on a set-top-box. It´s fast enough for the writing-speed and it gets erased all 2-3 weeks.But the 850 and 860 Evo works good and fast.
The QVO-series maybe beats other QLC-products like DRAM-less BX500 (so far never seen benchmarks of new Sandisk Plus with QLC) but is to expensive in capacities less than 8TB
WaltC - Monday, December 7, 2020 - link
This has to be the first NMEe .M2-interface vs. SATA3-interface SSD comparison that ignores the differences in bus connections as if they don't exist--or as if they don't matter. Scratching my head over this one. Max optimal bandwidth for Sata3 SSD's is generally less than 550MB/s. Max optimal bandwidth for an .M2 NVMe 3x4 PCIe 3 drive like the Sabrent here is 3.5-5.x GB/s. And for PCIe 4 3x4 NVMe drives like the 980 Pro from Samsung, the max optimal bandwidth is as much a 7+ GB/s. Comparing the internal drive controllers and the onboard ram between SSD's is fine and should be done--but *never* at the expense of treating the drive interfaces into the system as if they just don't matter, imo...;) If people are merely looking capacities and prices without regard to performance this might be a helpful review. But when is that ever really the case? With SATA3 SSDs, it doesn't really matter about the internals, the performance is caped at < 550MB/s. The bottleneck being the drive's system interface.peevee - Wednesday, December 9, 2020 - link
2TB of SLC is equal to 8TB of QLC. I doubt the SLC flash is separate from QLC, they probably use QLC in SLC mode until 2TB fill up, and then start compressing the data into QLC. So the switch might happen without constant sequential write too.ballsystemlord - Wednesday, December 9, 2020 - link
@Billy , Under "Random Write Performance" (burst and sustained,) you'll notice that you wrote the same comment twice by mistake.zhpenn - Monday, February 8, 2021 - link
About the 8TB version power consumption, I notice in the spec is 5.5W when compare to 860 EVO(4W) Can I put 870 QVO 8TB into a USB 3.0 SATA enclosure and used it without an unstable issue? or it may eject unexpectedly or slow speed due to high power consumption?PushT - Thursday, October 14, 2021 - link
How big is the cache on this drive ? The 32 GB "sustained"transfer falls within that cache, is that right ? Say I wanted to make a backup of my whole system, on this drive, or just move the backup to it, or other large files for that matter. How would the sustained 128KB write performance look ? Why do you test for this rather small transfer size when it only showcases the faster cache ? Am I wrong ? Please tell me why you can't just as well include longer and larger transfers, so as to show what happens when the QLC nand is written to ?PushT - Thursday, October 14, 2021 - link
To be fair this drive has a large dynamic cache. You can transfer a lot of data before you hit the QLC nand directly. But if you look at the review at Tom's you can see how the perfomance actually drops to 200 MB/s after the cache is filled up, about that of a WD black HDD. That is not too impressive. Also I wonder about the heat when you start using these small drives for bulk storage...PushT - Thursday, October 14, 2021 - link
With the Samsung 870 Evo, as an example, you can fill up the whole drive with sequential writes at 500 MB/s. Looking at a potential bulk storage solution, you would write a full hypothetical 8TB Samsung Evo 870 sata ssd in approximately 4,43 hours, whereas filling a Sabrent rocket 8TB would take about 6,2 hours. So depending on your usage, there are trade-offs. If I was to copy drives I don't see why I would use this over a top Sata ssd.