How to Save $6000 on a 28-core Flagship Intel Xeon: Platinum 8280 vs Gold 6258R
by Dr. Ian Cutress on August 7, 2020 8:00 AM ESTTest Bed and Benchmarks
For this test, we’ve run through our updated suite of benchmarks, as part of our #CPUOverload project. As this isn’t a strict review of the processors, more of a comparison article to see if they perform the same, then each benchmark is relatively binary– yes it performs the same, or no they don’t (and which one is better). For these tests, we fired up our single socket LGA3647 testbed.
| AnandTech LGA3647 Test Bed | |||||
| AnandTech | COLUMN | ||||
| CPU | Intel Xeon Platinum 8280 Intel Xeon Gold 6258R |
28C/56T 28C/56T |
2.7-4.0G 2.7-4.0G |
205W 205W |
$10009 $3950 |
| Cooling | Asetek 690LX-PN (500W) | ||||
| Motherboard | ASUS ROG Dominus Extreme (0601) | ||||
| DRAM | SKHynix 6 x 32 GB DDR4-2933 | ||||
| SSD | Crucial MX500 1TB | ||||
| PSU | EVGA 1600T2 | ||||
| GPU | Sapphire RX460 | ||||
| Chassis | Anidees Crystal XL | ||||
Both processors were tested on 192 GB of SK-Hynix DDR4-2933 RDIMMs, and a sufficient 500W liquid cooling configuration.
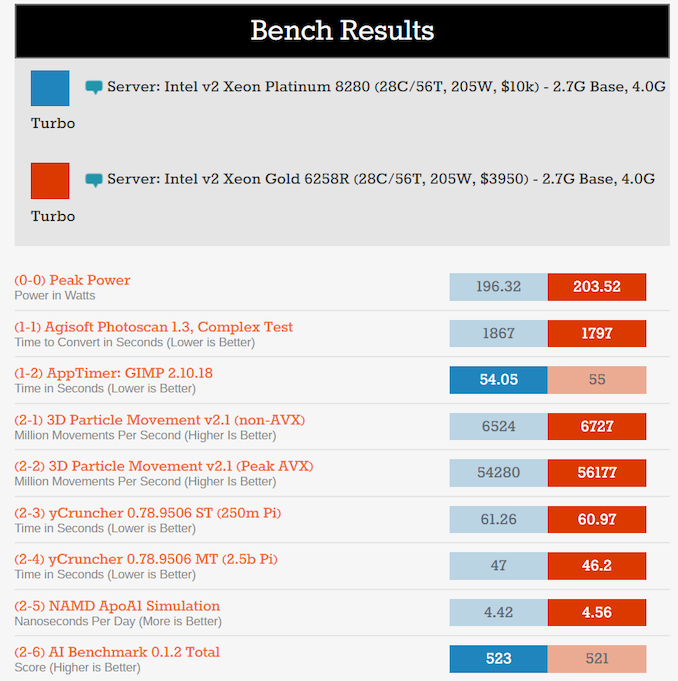
For non-performance benchmark related data, we saw both CPUs score the same average core-to-core latency (8280 was 45.8 ns, 6258R was 45.6 ns), both CPUs get to turbo from idle to max in 35-38 milliseconds, and power consumption was almost identical.

There is a slight variation here, though this could just be down to the specific voltage characteristics of the chips I have. The 6258R hits nearer the 205 W TDP that both chips have.
For the performance benchmarks, don’t get too excited all at once. We’ll mark any performance difference as significant where a >4% change is observed.
| Intel Xeon Scalable 2nd Gen Shootout | |||
| AnandTech | Platinum 8280 |
Gold 6258R |
Performance 6258R vs 8280 |
| Office | |||
| Agisoft 1.3 | 1867 sec | 1797 sec | 103.8% |
| AppTimer GIMP | 54.1 sec | 55.0 sec | 98.4% |
| Science | |||
| 3DPMavx | 54280 pts | 56177 pts | 103.5% |
| yCruncher 2.5b | 47.00 sec | 46.20 sec | 101.7% |
| NAMD ApoA1 | 4.42 ns/day | 4.56 ns/day | 103.2% |
| AIBench 0.1.2 | 523 pts | 521 pts | 99.6% |
| Simulation | |||
| DigiCortex 1.35 | 2.47x | 2.48x | 100.4% |
| DwarfFortress S | 124 sec | 124 sec | = |
| Dolphin 5.0 | 329 sec | 329 sec | = |
| Rendering | |||
| Blender 2.83 | 224 sec | 224 sec | = |
| Corona 1.3 | 13.30 Mray/sec | 13.64 Mray/sec | 102.6% |
| POV-Ray 3.7.1 | 10370 pts | 10461 pts | 100.8% |
| V-Ray | 36899 Kray/sec | 38366 Kray/sec | 103.98% |
| CB R20 ST | 391 pts | 393 pts | 100.5% |
| CB R20 MT | 11539 pts | 11851 pts | 102.7% |
| Encoding | |||
| Handbrake 1.3.2 4K | 74 fps | 74 fps | = |
| 7zip Combined | 183k MIPS | 189k MIPS | 103.2% |
| AES Encode | 15.9 GB/s | 16.4 GB/s | 103.1% |
| WinRAR 5.90 | 30.52 sec | 30.17 sec | 101.2% |
| Legacy / Web | |||
| CB10 ST | 8183 pts | 8185 pts | 100.02% |
| CB10 MT | 66851 pts | 66198 pts | 99.0% |
| Kraken | 929 ms | 929 ms | = |
| Speedometer | 90 rpm | 90 rpm | = |
| Synthetic | |||
| GB4 ST Overall | 4739 pts | 4737 pts | 99.95% |
| GB4 MT Overall | 65039 pts | 66274 pts | 101.9% |
| DRAM Read | 124 GB/s | 126 GB/s | 101.6% |
| DRAM Write | 102 GB/s | 102 GB/s | = |
| DRAM Copy | 115 GB/s | 116 GB/s | 100.9% |
| sha256 8k ST | 486 MB/s | 487 MB/s | 100.2% |
| sha256 8k MT | 12452 MB/s | 12833 MB/s | 103.1% |
| LinX 0.9.5 | 1484 GFLOPs | 1528 GFLOPs | 103.0% |
| SPEC (Geomean of tests, Estimated)* | |||
| SPEC2006 ST | 45.8 | 45.8 | = |
| SPEC2017 ST | 6.0 | 6.0 | = |
| SPEC2017 MT | 109.4 | 111.1 | 101.6% |
| *SPEC results not submitted to SPEC.org have to be labelled as 'Estimated' as per SPEC press licensing rules. | |||
Well, that was a whole lotta nothing.
If we retain that a 4% difference might be more than just statistical noise, then none of these benchmarks come close. A slightly blurry eye with these results might concede that the 6258R actually has the upper hand, which might go in line with the slight variation in power consumption we saw in the power test. But by and large, these chips are essentially identical in performance.
Breakdowns of most of the benchmarks and sub-tests can be found by looking at our benchmark comparison database, Bench. To get the best experience when comparing products on Bench. I find it best to increase the browser zoom and reduce the browser window width, so it looks like this:
Click on the image to go to the section in Bench that compares these two CPUs.


81 Comments
View All Comments
yankeeDDL - Friday, August 7, 2020 - link
I agree, in general. It is the same practice that most specialized SW vendors use: list prices are insane, and then you get a massive discount. Trouble is: when things get rough these discounts tend to shrink rapidly, because they can.Spunjji - Friday, August 7, 2020 - link
Exactly that. It's also a way of applying paradoxically high price penalties to smaller and/or less tech-literate buyers. I used to work for an IT reseller and it was amazing how many customers we picked up who had previously been paying list price for all of their purchases - hardware *and* software.Revv233 - Friday, August 7, 2020 - link
*this*When you are selling that new server to the end user you can show a discount under Intel's published price even after you've got your markup in there.
mrvco - Friday, August 7, 2020 - link
Definitely. Street price for any given entity is what matters or should matter. I doubt there is a reliable way to smoke out the actual price paid for the 8280 without violating enterprise NDAs, but I have to assume that the 6285 price is a reflection of the competitive pressure being applied by AMD and Epyc and the 8280 pricing has been similarly on a per account basis, just in case there are still some suckers out there.mrvco - Friday, August 7, 2020 - link
similarly --> adjusted <-- on aDuncan Macdonald - Friday, August 7, 2020 - link
There is one reason for the 6258R - Intel needs something at least remotely competitive to the EPYC Rome CPUs. For 1 or 2 socket servers the 8280 is far more expensive than AMD's EPYC 7742 while having less performance (due to 28 cores vs 64 and 38.5MB L3 cache vs 256MB)yankeeDDL - Friday, August 7, 2020 - link
So, instead of lowering the price they make a crippled sku at 40% of the price.I said in a previous comment: they do it because they can. Hopefully though, not for so much longer.
danbob999 - Friday, August 7, 2020 - link
AMD doesn't have anything in the 8 socket configuration. That leaves Intel pretty much a monopoly. In a typical monopolistic behavior, they raise prices. Nothing new here.The only thing is that a dual socket EPYC might outperform a 4 socket Xeon. So Intel need 8 sockets to take the performance crown.
SSNSeawolf - Friday, August 7, 2020 - link
Articles like this are important, to help validate that the chips do, in fact, perform similarly. Appreciate that you went through the work to run the tests.One small noteworthy difference is that the 6358R has one less UPI link, to go along with the 2P support. I'm curious about the power cos of each UPI link at idle (here in 1P configuration), but eyeballing the y-cruncher chart at the start it appears trivial.
Duncan Macdonald - Friday, August 7, 2020 - link
It is probably the same silicon - just with a fuse blown to disable the UPI link and restrict it to 2 sockets.