The Intel Core i9-9900K at 95W: Fixing The Power for SFF
by Ian Cutress on November 29, 2018 8:00 AM ESTCPU Performance: System Tests
Our System Test section focuses significantly on real-world testing, user experience, with a slight nod to throughput. In this section we cover application loading time, image processing, simple scientific physics, emulation, neural simulation, optimized compute, and 3D model development, with a combination of readily available and custom software. For some of these tests, the bigger suites such as PCMark do cover them (we publish those values in our office section), although multiple perspectives is always beneficial. In all our tests we will explain in-depth what is being tested, and how we are testing.
All of our benchmark results can also be found in our benchmark engine, Bench.
Application Load: GIMP 2.10.4
One of the most important aspects about user experience and workflow is how fast does a system respond. A good test of this is to see how long it takes for an application to load. Most applications these days, when on an SSD, load fairly instantly, however some office tools require asset pre-loading before being available. Most operating systems employ caching as well, so when certain software is loaded repeatedly (web browser, office tools), then can be initialized much quicker.
In our last suite, we tested how long it took to load a large PDF in Adobe Acrobat. Unfortunately this test was a nightmare to program for, and didn’t transfer over to Win10 RS3 easily. In the meantime we discovered an application that can automate this test, and we put it up against GIMP, a popular free open-source online photo editing tool, and the major alternative to Adobe Photoshop. We set it to load a large 50MB design template, and perform the load 10 times with 10 seconds in-between each. Due to caching, the first 3-5 results are often slower than the rest, and time to cache can be inconsistent, we take the average of the last five results to show CPU processing on cached loading.
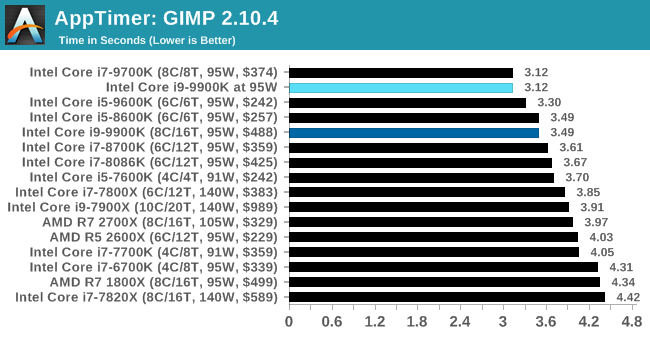
One of the interesting things in these benchmarks is that when in 95W mode, especially in shorter tests, the 9900K actually performs better than the full grunt settings. This could be because the system doesn't have to consider current limits of the power delivery, as 95W is the guaranteed limit no matter the loading.
FCAT: Image Processing
The FCAT software was developed to help detect microstuttering, dropped frames, and run frames in graphics benchmarks when two accelerators were paired together to render a scene. Due to game engines and graphics drivers, not all GPU combinations performed ideally, which led to this software fixing colors to each rendered frame and dynamic raw recording of the data using a video capture device.
The FCAT software takes that recorded video, which in our case is 90 seconds of a 1440p run of Rise of the Tomb Raider, and processes that color data into frame time data so the system can plot an ‘observed’ frame rate, and correlate that to the power consumption of the accelerators. This test, by virtue of how quickly it was put together, is single threaded. We run the process and report the time to completion.
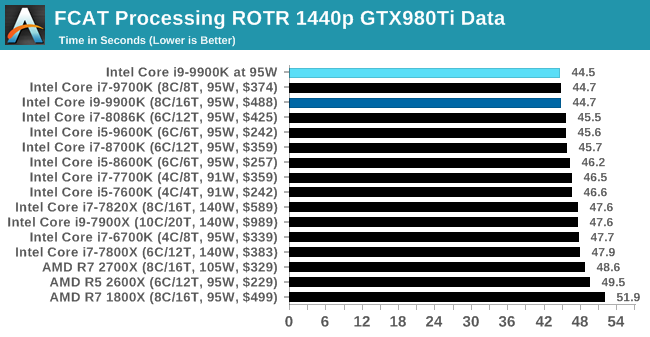
In a slightly longer test, the 9900K @ 95W eeks out the tiniest win.
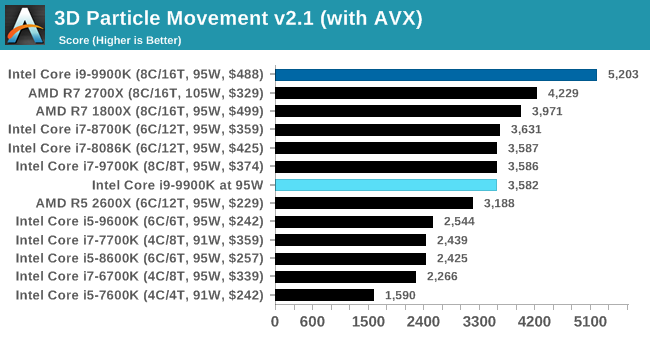
3D Particle Movement v2.1: Brownian Motion
Our 3DPM test is a custom built benchmark designed to simulate six different particle movement algorithms of points in a 3D space. The algorithms were developed as part of my PhD., and while ultimately perform best on a GPU, provide a good idea on how instruction streams are interpreted by different microarchitectures.
A key part of the algorithms is the random number generation – we use relatively fast generation which ends up implementing dependency chains in the code. The upgrade over the naïve first version of this code solved for false sharing in the caches, a major bottleneck. We are also looking at AVX2 and AVX512 versions of this benchmark for future reviews.
For this test, we run a stock particle set over the six algorithms for 20 seconds apiece, with 10 second pauses, and report the total rate of particle movement, in millions of operations (movements) per second. We have a non-AVX version and an AVX version, with the latter implementing AVX512 and AVX2 where possible.
3DPM v2.1 can be downloaded from our server: 3DPMv2.1.rar (13.0 MB)
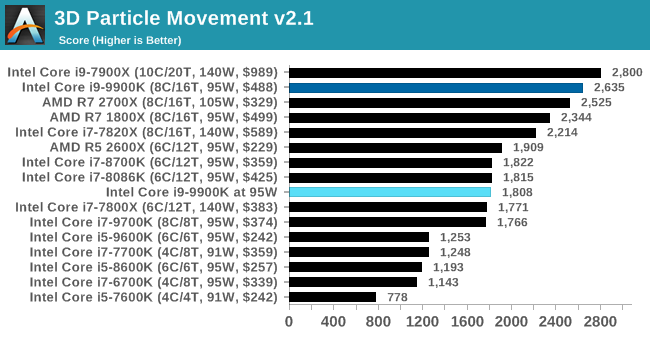
As we move onto something more substantial with all the threads, the 95W setting means that the result scores a heavy loss in 3DPM.
Dolphin 5.0: Console Emulation
One of the popular requested tests in our suite is to do with console emulation. Being able to pick up a game from an older system and run it as expected depends on the overhead of the emulator: it takes a significantly more powerful x86 system to be able to accurately emulate an older non-x86 console, especially if code for that console was made to abuse certain physical bugs in the hardware.
For our test, we use the popular Dolphin emulation software, and run a compute project through it to determine how close to a standard console system our processors can emulate. In this test, a Nintendo Wii would take around 1050 seconds.
The latest version of Dolphin can be downloaded from https://dolphin-emu.org/
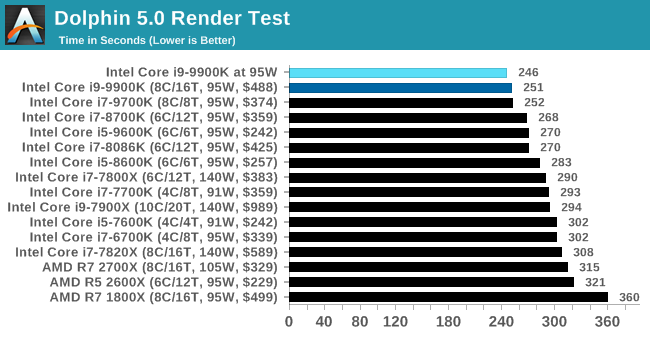
Dolphin is again a single threaded test, and the 9900K at 95W eeks out another small win.
DigiCortex 1.20: Sea Slug Brain Simulation
This benchmark was originally designed for simulation and visualization of neuron and synapse activity, as is commonly found in the brain. The software comes with a variety of benchmark modes, and we take the small benchmark which runs a 32k neuron / 1.8B synapse simulation, equivalent to a Sea Slug.

Example of a 2.1B neuron simulation
We report the results as the ability to simulate the data as a fraction of real-time, so anything above a ‘one’ is suitable for real-time work. Out of the two modes, a ‘non-firing’ mode which is DRAM heavy and a ‘firing’ mode which has CPU work, we choose the latter. Despite this, the benchmark is still affected by DRAM speed a fair amount.
DigiCortex can be downloaded from http://www.digicortex.net/
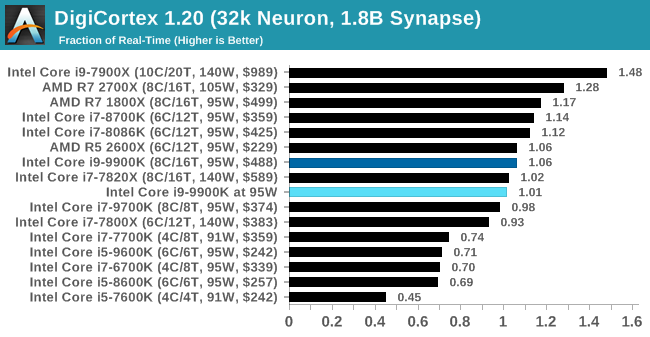
When it comes to a mixed benchmark like DigiCortex, the reduced power CPU actually performs around the same, given the same DRAM speed on both setups.
y-Cruncher v0.7.6: Microarchitecture Optimized Compute
I’ve known about y-Cruncher for a while, as a tool to help compute various mathematical constants, but it wasn’t until I began talking with its developer, Alex Yee, a researcher from NWU and now software optimization developer, that I realized that he has optimized the software like crazy to get the best performance. Naturally, any simulation that can take 20+ days can benefit from a 1% performance increase! Alex started y-cruncher as a high-school project, but it is now at a state where Alex is keeping it up to date to take advantage of the latest instruction sets before they are even made available in hardware.
For our test we run y-cruncher v0.7.6 through all the different optimized variants of the binary, single threaded and multi-threaded, including the AVX-512 optimized binaries. The test is to calculate 250m digits of Pi, and we use the single threaded and multi-threaded versions of this test.
Users can download y-cruncher from Alex’s website: http://www.numberworld.org/y-cruncher/
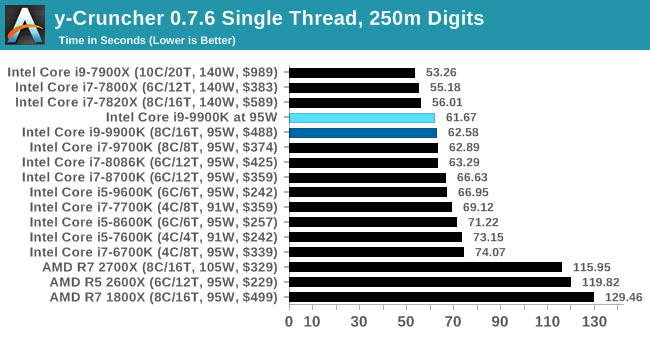
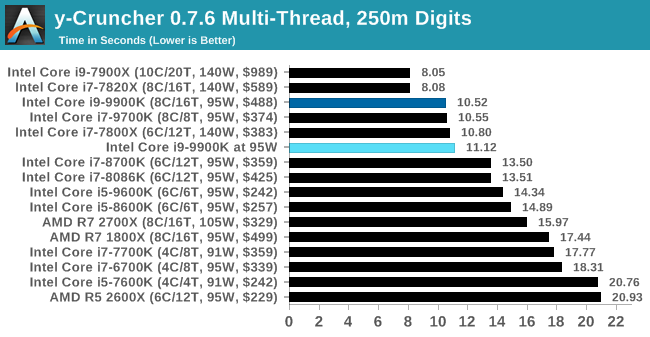
yCruncher shows another small win for the 9900K at 95W in single threaded mode, although this turns into a loss when all the threads are primed with AVX2 code.
Agisoft Photoscan 1.3.3: 2D Image to 3D Model Conversion
One of the ISVs that we have worked with for a number of years is Agisoft, who develop software called PhotoScan that transforms a number of 2D images into a 3D model. This is an important tool in model development and archiving, and relies on a number of single threaded and multi-threaded algorithms to go from one side of the computation to the other.
In our test, we take v1.3.3 of the software with a good sized data set of 84 x 18 megapixel photos and push it through a reasonably fast variant of the algorithms, but is still more stringent than our 2017 test. We report the total time to complete the process.
Agisoft’s Photoscan website can be found here: http://www.agisoft.com/
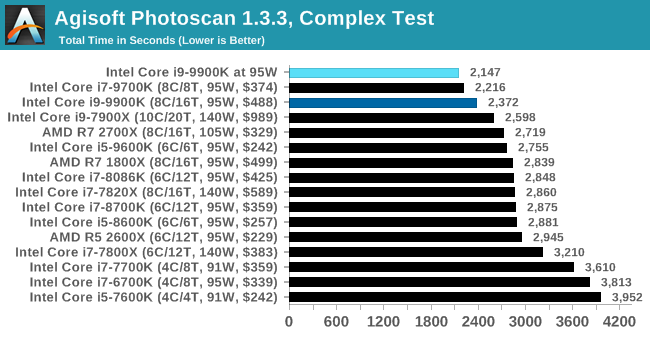
Photoscan is a mixed workload test, with certain portions being purely singe threaded and others being multithreaded. The 9900K at 95W wins by a good amount here.


101 Comments
View All Comments
Rukur - Monday, December 3, 2018 - link
9900K comes out of the box with 5Ghz so its going to win on games. The prize it a game stopper but.woggs - Thursday, November 29, 2018 - link
"This rises to 44.2 if the processor is fixed to 95W" but there is no data point on the plot at that spot. A mouse-over labeling of that plot would be very-helpful.romrunning - Thursday, November 29, 2018 - link
I don't understand - the article title says "Fixing the Power for SFF", and yet no motherboards with the form factor typically used in SFF systems were actually tested. The motherboards listed were all ATX; no mini-ITX or even micro-STX boards were used.Why not? Wouldn't this have provided valuable insight for those looking to purchase a SFF system, custom or DIY, to see which mfgs cap the TDP usage or let it go full range?
The author said he tested a MSI Vortex G3 small form factor desktop last year. Well, why not get some comments from ASRock, Gigabyte, ASUS, and MSI as to whether it's standard practice for them to limit CPUs to a specific power limit in their BIOS for those SFF boards.
Fro example, I'd love to know if that sweet-looking ASRock DeskMini GTX Z390 that was recently reviewed can take the i9-9900k rated at 95W to the full "unlimited" power settings. I can put 450-600W SFX/SFX-L PSUs into a SFF system, so I'd like to know if I can get the full performance out of the CPU or if the mfg locks the power draw in the BIOS.
SaturnusDK - Thursday, November 29, 2018 - link
Why is this article, and Anandtech in general, using 1000 unit OEM prices for Intel products which are typically 15-20% less than the lowest retail price you can find. But use the highest you can find retail prices for AMD products? It seems like Anandtech is deliberate trying to make people think Intel products have any value when the reality is that they don't.Rezurecta - Thursday, November 29, 2018 - link
Good re-review. Although, Ian doesn't seem to want to call Intel out. This is OBVIOUSLY something initiated by Intel. If the 9900k were to run in spec it would be slower than the 2700x in a LOT of benchmarks. Intel couldn't have that for such a massive hot monolithic die. That's why all the shady sponsored benchmarks and having the processor way out of spec.It's obvious Intel is hurting. Let's hope this brings about a competitive landscape again.
kernel-panic - Thursday, November 29, 2018 - link
it would be nice if somewhere you let readers know what TDP, PL1 and PL2 mean. I enjoy this kind of articles but I'm not related with the terminology.Icehawk - Thursday, November 29, 2018 - link
It's in the (by now) linked article at the very beginningMr Perfect - Thursday, November 29, 2018 - link
How do motherboards treat the non-k versions of these CPUs? When I built my mITX machine, I bought the non-K processor since there wouldn't be any overclocking going on. Just how locked is a locked CPU? Technically, this could be considered turboing ratehr then overclocking and could be applied to the non-Ks.Targon - Sunday, December 2, 2018 - link
It is possible that Intel won't release a non-k version of these chips, just because there won't be a significant enough performance benefit vs. the AMD 2700X if the chips were not being pushed to their absolute limit.stux - Thursday, November 29, 2018 - link
An interesting point that you make is that a 9900K constrained to 95W performs like an unconstrained 9900K for single threaded loads and an unconstrained 9700K for multithreaded loads.The 9700K has half the threads, so that is an interesting claim, and I think the key is how does the 9700K perform when constrained to 95W.
Hyperthreading is supposed to be a big win to perf/W, thus I’d expect 9900K at 95W to be more efficient than the 9700K for the same perf, which is a definitive win too.
How does the 9700K at 95W perform in the multi threaded benchmarks?